Case Study
Fiber Outage in
The
The PingER team carried out an
analysis of the level of global connectivity and performance of the country’s
network infrastructure before, during and after the outage. The statistics and
graphs are based entirely on the PingER data. This includes
monitoring various nodes from SLAC and the World. Some measurements have also
been made from within
The data obtained is a result of
monitoring the following hosts in
|
Nick Name |
Node Name |
Service Provider |
Name of
Institute/Node |
Location of Host |
|
|
|
|
|
|
|
PK.NIIT.EDU.N1 |
NTC |
NUST
Institute of Information Technology |
|
|
|
PK.QAU.EDU.N1 |
NTC |
|
|
|
|
PK.UET.EDU.N1 |
NTC |
|
|
|
|
PK.PIEAS.EDU.N1 |
NTC |
Pakistan
Institute of Engineering and Applied Sciences |
|
|
|
PK.DSL.NET.SVR.N2 |
Micronet
Broadband |
Micronet
Broadband |
|
|
|
PK.DSL.NET.N1 |
Micronet
Broadband |
Micronet
Broadband |
|
|
|
PK.DSL.NET.GTWY.N1 |
Micronet
Broadband |
Micronet
Broadband |
|
|
|
PK.LCWU.EDU.N1 |
Brain Net |
|
|
|
|
ORG.WB.SDNPK.N1 |
Habib
Rafiq |
Area
Development Programme, Balochistan |
|
Table 1: Nodes involved in the
monitoring in
Effect of Fiber Outage
June-July 2005
The effect of the fiber outage is
studied in a fair amount of detail. Although backup satellite connectivity was
provided, the quality of the backup link, as expected, was very poor. Moreover,
it was perceived that the full connectivity would be restored in 3-4 days, but
in actual fact the outage lasted for 12 days (http://www.jang.com.pk/thenews/jun2005-daily/30-06-2005/main/main13.htm).
Figure:
1:
Median, 25 and 75 percentile of packet loss from SLAC to the various institutes
in
The sudden increase in spikes loss seen towards
the end of June suggests inficates that during the
fiber outagethat during the outage, the
reliability of the connectivity had downgraded to a huge extent. The
packet loss from SLAC to ITU
Standards suggest that the Qquality
levels for packet loss were set at 0-1% = good, 1-5% =
acceptable, 5-12% = poor, and greater than 12% = bad. More recently, the levels
have been refined to 0-1% = good, 1-2.5% = acceptable, 2.5-5% =
poor, 5%-12% = very poor, and greater than 12% = bad (http://www.slac.stanford.edu/comp/net/wan-mon/tutorial.html#loss).
This
is due to the change in emphasis and the nature of applications now being used
over the internet. The median value in Fig 1 suggests vindicates
that the outage period falls under the “bad” category, but data from Feb’04 and
onwards shows that the overall connectivity of the Pakistani various universities
seen
from SLAC in the from
Figuure 2: Shows the minimum RTT
measured by PingER from SLAC to the various universities in
As the main fiber connectivity
link halted, there was a sudden jump in the Minimum Round Trip Times as well. Due to
excessive increase in the traffic over the This is mainly due to the
change from a land-line link to a geostationary satellite which imposes an RTT
of ~ 600ms.Satellite link via “globalconnex”, located in
Netherlands, the RTT values jumped a great deal due to re-routing of the
traffic over satellite links. This did not only happen with one or
two nodes but every node located in Pakistan. Under normal circumstances, the
traffic is routed via Singtel (
Figure 3: The ping unreachability[1] to Pakistan Universities seen from SLAC.
Usually, nodes in However, towards
the end of June, the percentage of unreachability soared as high as 18-19% for
most nodes. During the outage, quite a few nodes in
RTT and Packet Loss from SLAC to NIIT
Fig 4
These graphs show that the links
have had huge amount of packet losses. At least once a month, the losses go as
high as 20% (small circles) and occasionally, reaching the cent per cent mark
(red circle). This goes to show the extreme unreliability of the link. The big
yellow circle towards the end shows fiber outage in
Fig 5
The unreachability of
Comparison of the Links to Various
Universities during the Internet Outage
We also carried out a comparison of the overall reliability (based on average Packet Loss) from SLAC to various universities in the country. NIIT was found to be the most disrupted link during this period, with an average packet loss of around 20%. Packet Loss of over 12% makes link fairly unusable (http://www.slac.stanford.edu/comp/net/wan-mon/tutorial.html#loss).
Fig 6
Longer term
performance of NTC links seen from US
There were some very interesting
observations that resulted from the case study. NTC (National Telecommunication
Corporation), the official service provider of the government of
Fig 7
In these
graphs, it is very evident that the NIIT, QAU and PIEAS nodes get a fairly poor
quality of service. Since one of the nodes at Micronet Broadband
(mbl.dsl.net.pk) is also being monitored, the reaction to small outages is less
as compared to NTC. Two possible conclusions could be that either there is some
major problem with the NTC network, or the overall cabling in the country is
not up to the mark. Whatever the reason may be, only the NTC can provide a
final answer. It is also worth mentioning here that the average RTT values to
the nodes provided service by the NTC is approximately 10-15 % higher than the
nodes provided service by Micronet. This does not include NIIT, where the RTT
values are highly inconsistent, with occasional spikes reaching 900 ms or even
beyond, with almost more than half of the delay coming in the NIIT-NTC link.
The fluttering route problem has been brought to the notice of NTC officials
more than once; emails dated March 24th,
April 5th, April 15th, and
Fig 8
This how the minimum Round Trip Times from SLAC to various institutions in
Pakistan have looked since we began monitoring various nodes in the country
from December. The RTT value from the West Coast to anywhere in
Longer term
performance of Links within Pakistan
This outage also gave us an opportunity to explore the connectivity of
various
1) Avg RTT value in range of 100ms; A possible explanation could be the change in ISPs, for instance average RTT from NIIT (using NTC) to Quaid-e-Azam University, PIEAS and UET, all using the services of NTC fall under this category.
2) Avg RTT value close to 300ms; Whenever, the ISP changes, we notice a huge jump in the Avg RTT values, for instance from NIIT (using NTC) to Micronet Broadband and Area Development Programme using Habib Rafiq fall under this category.
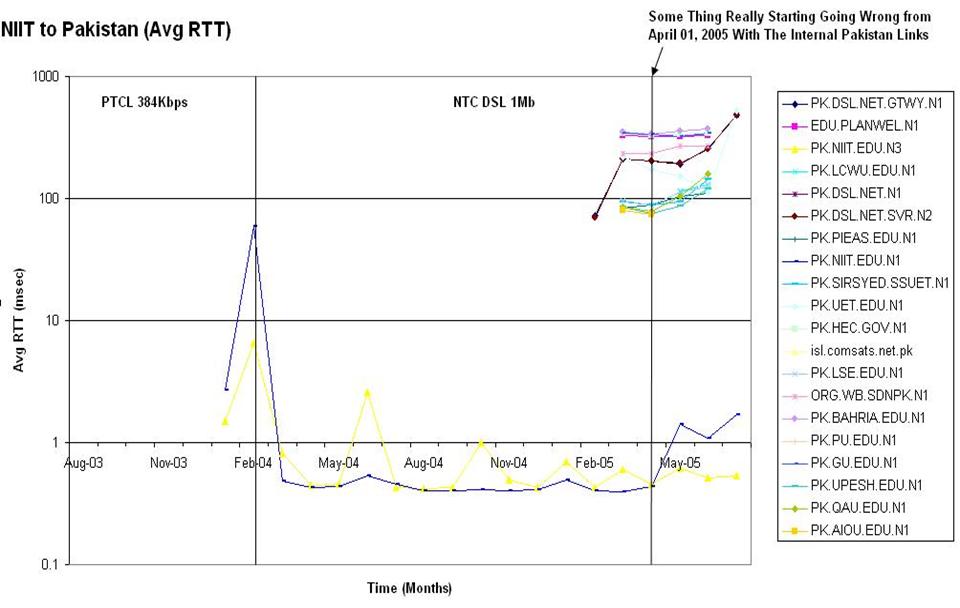
Fig 9
When we look at the graph of average RTT from NIIT to the rest of
![]()
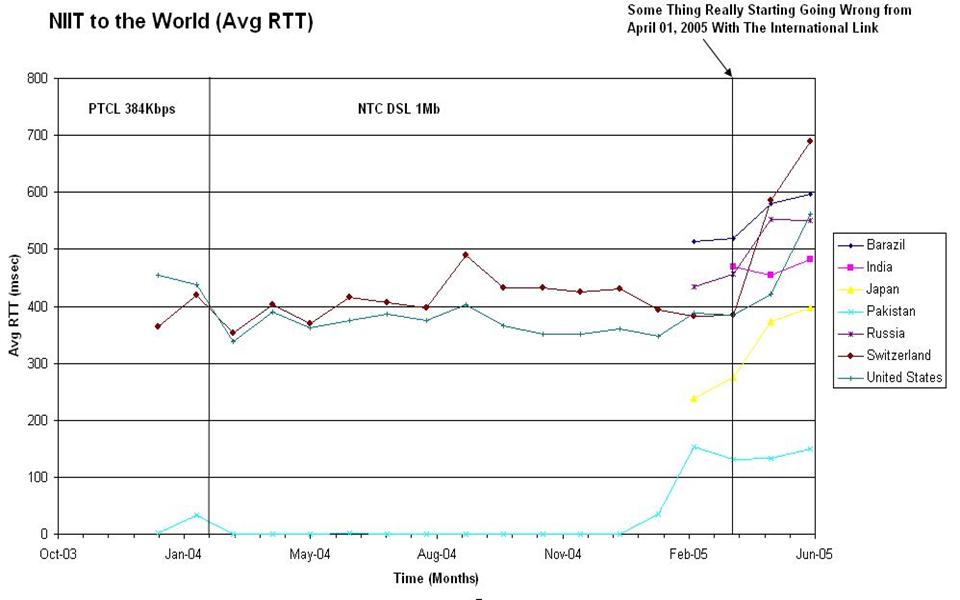
Fig 10
This graph shows the average RTT values from NIIT to the rest of the world. All values are based on averages of various nodes in different countries. For a more detailed overview of how these values are obtained, kindly refer to the PingER project. You can also look at the PingER Reports page to see how this data is obtained. As we observe, April was the time when the country’s link actually began to degrade. Towards the end of the graph, we notice the effects of the outage, which is evident towards the end of June’05. The red circle shows the variation in the country’s local link. This is one area where a lot of optimization has to take place. This can only happen if all the ISPs, especially the broadband service providers and the government collectively want to solve this problem.
The RTT values to different countries should be directly proportional to the
distance between them. With
Fig 11
Another common problem that
Different
parameters; Average RTT, Minimum RTT, Throughput; over the last 60 days from
SLAC to Pakistan
Fig 12
This graph shows the average RTT
values over the last 60 days from SLAC to various universities in
Fig 13
This graph shows the average
packet loss percentages over the last 60 days from SLAC to various universities
in
Fig 14
This is the 60day throughput graph
from SLAC to various institutions in
Fig 15
This graph shows the percentiles for values of throughput shown above. The yellow line, which is the Standard deviation, is very high, which speaks of the inconsistency in the throughput obtained. Notice the few small dots between the 27th Jun and 7th July.
Fig 16
This graph is for the last 60 days
from SLAC. It shows that among the Pakistani institutes, NIIT and
Comparison
between the Major Broadband Service Providers in
Based on out findings, we
prepared a brief comparison between the services of the major service providers
in
Fig 17
As evident, the data for the last
60 days shows that NTC has had way higher packet loss as compared to Micronet. These
are currently the major service providers to most of the universities that we
are monitoring. Also, it is worth considering for PERN that if they are
availing the facility from NTC, is the best and the most reliable service in
Fiber Outage in March 05
While digging up the data, we also studied the impacts of the internet outage in March 05 (http://www.jang.com.pk/thenews/mar2005-daily/26-03-2005/metro/i8.htm ), which occurred due to the disconnection of the power cable of Pakistan Telecommunication Corporation (PTCL) by the "excavators of Karachi Water and Sewerage Board hired by SITE Limited Factory".
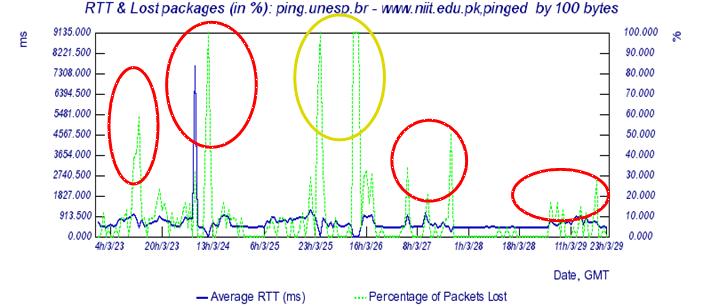
Fig 18
The yellow circle highlights the Three Hour outage (http://www.jang.com.pk/thenews/mar2005-daily/26-03-2005/metro/i8.htm) but the red circles are impossible to explain. This goes to show, that even when the cable is fine, the internet quality is fairly low. Just to highlight, that any node having a regular packet loss of greater than 4% on a regular basis shows that the link quality is poor. For further information on packet loss comparisons, check out the PingER Tutorial. We have spikes going as high as 30-40% during some parts of any given day.
Fig 19
The MOST SHOCKING of them all; this is happening within NIIT, part of the same lab. I can not believe that the PTCL outage was felt within NIIT too!!
Fig 20
This is how the outage should have looked like; a three hour cut and then smooth. There are occasional spikes but not as many as we see below.
Fig 21
Fig 22
I can understand that there was an outage, but what’s most shocking is the performance before and after the outage.
Fig 23
Since the data was very surprising due to the nature of these spikes, we dug deeper and confirmed that NTC feels the maximum impact of all these outages. Even when there are no outages, NTC customers feel the outages every now and again.
Fig 24
NIIT, to whom the service is being provided by NTC (National Telecommunication Corporation); the official IT&T service provider to the Government of Pakistan and a subsidiary of PTCL, seemed to have been hit worst by the outage. Seems like it took them quite a lot of days to recover.
Prepared by: Les Cottrell and Aziz Allaudin Rehmatullah