PLOT TUNES
The plot tunes function plots betatron and synchro-betatron resonance lines as well as the PEP II X/Y tunes. The tune values are from EPICS variables as measured by the tune tracker system.
You can run the program from the SCP by clicking on the "Plot Tunes GUI" button off the tune tracker history panel.
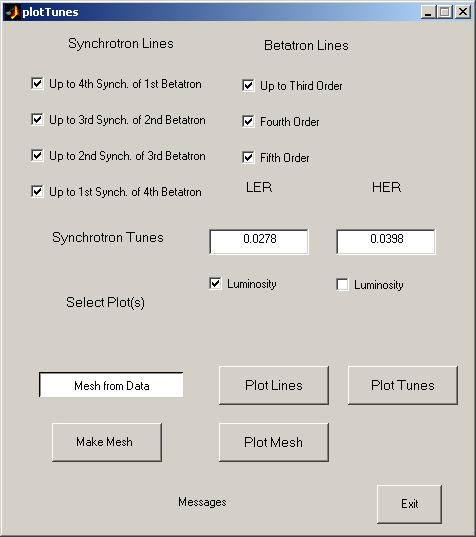
The Plot Tunes GUI control panel looks like this:
Some things to note:
- The production version does not have the mesh options at the moment. Once I figure out how to do this on the gateway machines I'll add this feature.
- Using the check boxes the user can select a given set of resonance lines to plot. The "Plot Lines" button then plots the lines. The "Plot Lines" button also clears any previous plots and resets the graphics window to default values.
- A value for the synchrotron tune for each ring can be entered by the user. This value is then used to recalculate the synchro-betatron lines.
- The "Plot Tunes" button starts a N point acquisition loop. (N = 700 for now)
The next picture shows a sample of the resonance lines plotted:
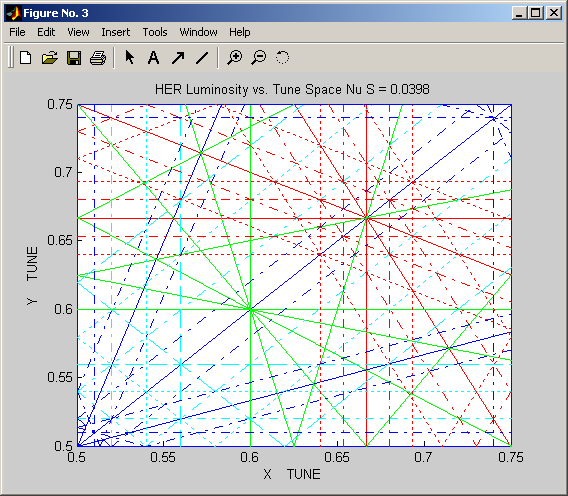
Some things to note:
- Solid lines represent a pure betatron resonance, dashed lines are used for a synchro-betatron resonance. Also, all lines of a given order are the same color.
- All the lines plotted are of the form: A * NuX + B * NuY + C * NuS = D. Where A, B, C, and D are integers. For a given line, A + B gives the betatron resonance order, and C gives the synchro-betatron order. (For an introduction to tune resonance lines, including details on witch magnetic pole expansion corresponds to a given resonance, click here)
Programming notes and future upgrades:
- The program is a compiled stand alone version of a MATLAB function. It does not use a MATLAB license to run. It runs on OPI00GTW00, and uses MATLAB channel access calls to get the tune tracker data.
- Mesh plot: Having sufficient historical luminosity and tune data, a three dimensional plot can be generated. The z axis being the luminosity or the lifetime, and the x-y plane being the machine tunes. The data for the mesh plot can be obtained from a strip tool or EPICS channel archiver. Once I figure out how to do this on the gateway, it will be implemented.
- More lines: Do we need higher that 5th resonance?
- Chromatic spread ellipse: The user would be able to enter chromaticity and energy spread values. An ellipse around the tune value could be plotted.
- Beam-beam tune spread: The user would be able to enter beam-beam tune spread values. A beam-beam footprint would be plotted.
- More? send email to colocho@slac.stanford.edu