The Presampler for the Forward and Rear Calorimeter in the ZEUS Detector

A.Bamberger, A.Bornheim, J.Crittenden, H.-J.Grabosch, M.Grothe, L.Hervas, E.Hilger, U.Holm, D.Horstmann, V.Kaufmann, A.Kharchilava, U.Kötz, D.Kummerow, U.Mallik, A.Meyer, M.Nowoczyn, R.Ossowski, S.Schlenstedt, H.Tiecke, W.Verkerke, J.Vossebeld, M.Vreeswijk, S.M.Wang, J.Wu
*[1cm] Physikalisches Institut der Universität Bonn, Bonn, Germany
Deutsches Elektronen-Synchrotron DESY, Hamburg, Germany
DESY-IfH Zeuthen, Zeuthen, Germany
Fakultät für Physik der Universität Freiburg i.Br., Freiburg i.Br., Germany
Hamburg University, II. Institute of Exp. Physics, Hamburg, Germany
University of Iowa Physics and Astronomy Dept, Iowa City, USA
Univer. Autonoma Madrid, Depto de Fisica Teorica, Madrid, Spain
NIKHEF and University of Amsterdam, Netherlands

Abstract:

The ZEUS detector at HERA has been supplemented with a presampler detector in front of the forward and rear calorimeters. It consists of a segmented scintillator array read out with wavelength-shifting fibers. We discuss its design, construction and performance. Test beam data obtained with a prototype presampler and the ZEUS prototype calorimeter demonstrate the main function of this detector, i.e. the correction for the energy lost by an electron interacting in inactive material in front of the calorimeter.

Introduction

The material situated between the electron-proton interaction point and the front face of the uranium-scintillator calorimeter within the ZEUS detector at HERA [1] leads to a degradation of the calorimetric energy measurement of the particles produced in the interaction. We have constructed a presampler detector, now installed directly in front of the forward and rear ZEUS calorimeter sections, with the goal of measuring this energy degradation on an event-by-event basis. The detector consists of a layer of scintillator tiles; wavelength-shifting fibers, embedded in the scintillator, guide the scintillation light to photomultipliers. Particles which shower in the material in front of the presampler lead to an increased particle multiplicity which is measured by the presampler. The combined information from the presampler and the calorimeter allows an event-by-event measurement of the energy loss in front of the calorimeter and thus allows to recover the energy scale and energy resolution of the ZEUS calorimeter. We describe the production and performance of the optical components, the assembly of the presampler detector, the readout system and the calibration system. We summarize results on the response of the individual tiles to cosmic rays and results of a test of a prototype presampler in combination with the ZEUS calorimeter prototype in a CERN test beam.

Scintillator/fiber combination

The segmentation of the presampler matches that of the ZEUS calorimeter [2] hadronic sections, 20 x 20 cm. The scintillation light is read out by wavelength-shifting fibers embedded in the scintillator and transported by clear fibers to a photomultiplier. Since the calibration of the presampler is performed with minimum-ionising particles (MIP) we require a photoelectron yield of at least 5 photoelectrons per MIP at the photocathode of the photomultiplier (PMT).

We have investigated several combinations of scintillator material, fiber material and fiber layout to optimize light yield and response uniformity, resulting in the following choice:

Fiber production.

The faces of the fibers were smoothed in steps with sandpaper of various granularities down to a grain size of a few microns. For this purpose a mounting support was designed which held 50 fibers individually. In this manner the cladding was prevented from cracking and the resulting face was perpendicular to the fibre-axis. One face of each WLS-fiber was also polished and then aluminized by vacuum evaporation in order to prevent light loss through this end.
For an optimal joint between the WLS-fiber and the clear readout-fiber a gluing procedure was chosen . Steel tubes, with an inner (outer) diameter of 1.1 (1.2) mm, served for good matching of the fibers and reinforcement of the joint. Special care was taken to get a tight joint by applying gentle pressure during hardening.

All fibers were tested for light transmission using a monitored UV-lamp. The fibers with lowest transmission were discarded (10%) resulting in a spread of 12%for the remaining fibers.

Light yield measurement

The absolute light yield for minimum-ionising particles was measured in a cosmic ray telescope with an effective area of 12 x 12 cm. The PMT pulse was integrated by a LeCroy 2249A ADC, triggered by a threefold coincidence of the signals from the cosmic trigger. The ADC gate length was 100 ns. Figure 1 shows the response to cosmic ray particles for the final tile/fiber/PMT layout.

figure 1
Fig. 1
Response of a scintillator tile to cosmic muons. The peak around the pedestal value of 45 ADC counts is due to false triggers and zero response due to photostatistics.

The ratio of triggers with no signal above pedestal recorded in the ADC to the total number of triggers is equal to (0.370.03%), taking into account the trigger efficiency. From this we obtain an absolute light yield of 5.6.1 photoelectrons.

Uniformity measurement

The tile uniformity was measured with a collimated Ru source, a computer-controlled x-y scanning table as scintillator support and an XP2020 photomultiplier. The ADC was triggered by a coincidence of two photomultiplier signals reading out a large trigger counter located underneath the tile to be tested (figure 2 ). To ensure that the Ru source simulates minimum-ionising particles, we measured the light yield of the tile also with the cosmic telescope. The pulse height spectra of cosmic muons and electrons from the Ru source are very similar in shape, with peak values equal within 5%. A 3-mm-diameter collimator was used to measure the response over a 20 x 20 cm tile in steps of 2 mm in x and y. The response is uniform within 5%.

The distribution of the mean values of the measurements for all positions is shown in figure 3 . The slight bump below 120 channels is an effect occurring near the edge of the tile where some particles leave the tile before crossing its full thickness.

figure 2
Fig. 2
Scanning table uniformity measurement

figure 3
Fig. 3
Spread of response over a tile. The response is uniform within 5%.

Mechanical layout

Tile assembly

The scintillator tiles are assembled in cassettes, made of 0.4 mm thick stainless steel; they are 20 cm wide and vary in length, containing between 1 and 10 tiles. In order for the readout fibers to clear the neighboring scintillator tile the 5 mm thick tiles are raised at the readout end, supported by a 2.5 mm thick rohacell strip. The total thickness of the cassette is 11 mm and represents about 5 %of a radiation length (1.2 %for the scintillator and 4 %for the stainless steel). The length of readout fibers is 300 cm. The six readout fibers of one tile are glued together in a connector which is fixed to the PMT housing. In addition to the six fibers a seventh clear fiber is added to guide the light from a laser/LED system to the PMT.

Detector assembly

The forward and rear calorimeters are split in two halves, such that they can be withdrawn from the beam pipe region during injection of the electrons and protons in HERA. A group of 19 cassettes, which covers one half of each calorimeter face, is glued on a 2 mm thick aluminium plate (0.02 radiation lengths) of 2 x 4 m.

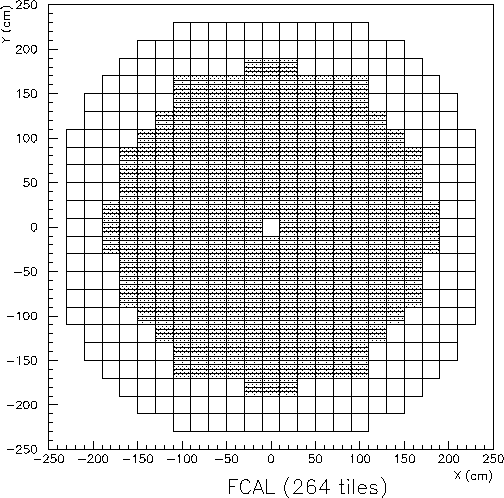
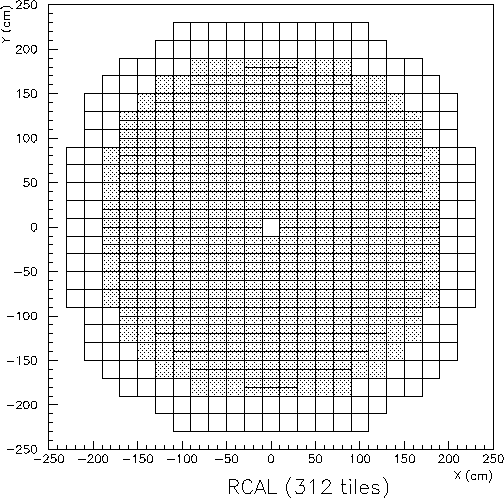
Figure 4 shows the coverage of the calorimeter by the presampler. Shown is the segmentation of the electromagnetic sections, which is finer in the region not shadowed from the nominal interaction point by the barrel calorimeter. The 20 x 20 cm towers covered by the presampler tiles are shaded.

figure 4a figure 4b
Fig. 4
Front view of the forward (FCAL) and rear calorimeter (RCAL). The 20 x 20 cm white square in the center corresponds to the hole for the beam pipe. The coverage of the presampler is indicated by the shaded region.

A 2.5 mm diameter tube is glued over the full length on the outside of each cassette, positioned at the center of the tiles. The tube guides a radioactive source for calibrating the light output of the individual tiles and the gain of the PMT channels (see section 7.2).

Photomultiplier tests

Performance specifications

Due to the limited space available in the ZEUS detector it was decided to use multichannel PMT's. The magnetic field amounts to a few hundred Gauss in the area where the PMT's are located and therefore adequate shielding is needed. Since we measure pulse heights, the crosstalk between adjacent channels in the tube is required to be less than 5%. Another requirement is the size of the photocathode for a single channel, which must match the readout fibers of one scintillator tile.

The Hamamatsu R4760 16-channel photomultiplier has been extensively tested for our application (see also [3]). This is a 4 x 4 multichannel PMT with a front face of 70 mm diameter. Each of the 16 channels has a 10 stage dynode chain, but they all share the same voltage divider. The diameter of the photocathode for each channel is 8 mm. Our PMT's fulfill the following requirements:

The crosstalk has been measured to be less than 3%.

HV supply and linearity measurement

A high voltage system based on the use of a Cockcroft-Walton generator has been developed [4]. Power dissipation is negligible compared to that of a resistive voltage divider. The system can be safely operated because of the low voltage input and provides a protection against high currents (light leaks); the maximum anode current is 100A. The HV units consist of a microprocessor board and the voltage multiplier boards. The microprocessor performs the HV setting and monitoring.

The R4760 PMT operates in the range 800-1200V. Tests showed that the optimum linearity is obtained (at the cost of a slightly lower gain) if the dynode voltage differences are distributed in the proportions 2:1:1:1:1:1:2:2:4:3, starting at the cathode. Since a pulse height measurement is required, good knowledge of the relation between input charge and output signal is necessary. For the linearity measurement we used an LED and a linear neutral density filter. As an example we show in figure 5 the deviation from linear behaviour versus anode charge for a HV setting of 1100V. The dotted line shows the linear fit through the first four points, the dashed line represents a polynomial fit through the last four points.

figure 5
Fig. 5
Results on the PMT nonlinearity. The line shows the linear fit through the first four points. The dashed line represents a polynomial fit through the last four points.

At an anode charge of 25 pC the measured values are about five percent lower than expected for linear behaviour. These values vary strongly from channel to channel and from PMT to PMT.

Readout system

The readout system is a copy of the existing ZEUS calorimeter readout system with some minor modifications [5]. The PMT pulses are amplified and shaped by a pulse shaper circuit mounted at the detector. The shaped pulse is sampled every 96 ns (the bunch crossing rate of the HERA storage ring) and stored in a switched capacitor analog pipeline. After receipt of a trigger from the ZEUS detector, eight samples are transferred from the pipeline to an analog buffer and multiplexed to ADCs. The data are sent to a location outside the detector where the digitisation and signal processing takes place. The modifications consist of upgraded versions of the shaping/amplifier [10] and the digital signal processor and a different mechanical layout of the analog front end cards.

Results from cosmic ray measurements

A cosmic ray test was performed to measure the light yield of the 576 tiles ( 264 FCAL and 312 RCAL tiles) assembled in 76 cassettes. The trigger system consists of eight cosmic ray telescopes. Each of these consists of two scintillator pads, 20 cm apart, with an area of 12 x 12 cm which give, together with a third scintillator counter of 240 x 12 cm, a trigger system with a three-fold coincidence. The efficiency of each single telescope was better than 98%. The readout PMT was a 16-channel R4760 as used in the final presampler design. The setup allows the measurement of 16 channels simultaneously ( e.g. two cassettes with eight tiles each). The trigger rate of the complete setup was about 50 counts/min with about 6 counts/min for a single telescope. An example of the cosmic-test measurement is given in figure 1 . To compare the light yield of different tiles, all 16 channels of the PMT were calibrated with a reference tile to correct for differences in quantum efficiency (QE) and gain between the 16 PMT channels. Figure 6 shows the mean value for all 576 tiles normalized to one of them. From the RMS value of the distribution we conclude that the responses of all tiles are equal to within 12%.

figure 6
Fig. 6
Average pulse height for cosmic muons normalized to one after having corrected for the gain differences between individual PMT channels.

Figure 7 shows the mean number of photoelectrons for each tile assuming a QE of 8.5%which is the minimum value accepted for the presampler PMT's (the mean QE for all channels is 11.6%).

figure 7
Fig. 7
Average number of photoelectrons per tile per MIP.

Calibration tools

Minimum-ionising particles in situ

During the operation of ZEUS, halo muons and charged hadrons are used to determine the response to single particles for each individual channel. The high voltage setting common to the sixteen pixels of one R4760 PMT is chosen such that the pixel with the least gain has an average response to minimum-ionising particles which is a factor of ten greater than the RMS noise level of the analog signal-processing front-end electronics (0.05 pC). The pixel-to-pixel gain variation of about a factor of three within one PMT results in a similar variation in the saturation levels. The in situ calibration for the 1995 running period achieved a precision of better than 5%per tile.

The radioactive source system

We use an LED/laser system to monitor the gains of the PMT's and a source system to monitor the combined response of tile, fiber and PMT. The response to a Co source provides a relative calibration and quality control of the individual channels of the presampler. The source scans take place during shutdowns of HERA and provide information on the long term behaviour of the light output of the combination of scintillator and wavelength-shifting fiber.

figure 8
Fig. 8
Example of a cassette with 9 scintillating tiles and source tube glued on top, connected to source scanning system.

Brass tubes with 2.5 mm outer diameter and 0.2 mm wall thickness run over the full length of the cassette, positioned in the middle (figure 8 ). They guide the pointlike (0.8 mm diameter, 1 mm length, 74 MBq) source. The source is driven in 2 mm steps via a 1.2 mm diameter steel wire by a stepper motor [6] controlled by a PC. The PMT currents are integrated with a time constant of 24 ms and read into a 16-channel 12-bit ADC card.

Figure 9 shows as an example the superposition of the responses of the tiles within one cassette as a function of the location of the source. The different heights of the maxima are mainly due to the different gains of the 16 channels of the R4760 PMT, all supplied with the same high voltage. The Co source is not collimated, as can be seen in the shape of the individual peaks.

figure 9
Fig. 9
Responses of the scintillating tiles within one cassette to a Co source. The step width is approximately 2 mm.

Beam test results

The influence of material in front of the ZEUS calorimeter on its energy measurement has been studied previously in several test beam runs with the ZEUS forward calorimeter (FCAL) prototype [7]. The corrections to the calorimetric measurements that can be derived from presampling measurements have been studied in subsequent test periods for both hadrons and electrons [8]. In the following we summarize the most recent results obtained for electrons with the final presampler design [9].

figure 10
Fig. 10
Experimental setup of the FCAL prototype and presampler in CERN test beam. The presampler is mounted directly on the FCAL frontplate.

Overview

The presampler prototype consists of an array of 4 x 4 scintillator tiles covering an area of 80 x 80 cm. As shown in figure 10 it is positioned directly in front of the ZEUS FCAL prototype which has the same lateral size. The depth of the calorimeter is 7 interaction lengths [7]. Beam tests were performed in the X5 test beam of the CERN SPS West Area. The prototype presampler detector is read out via an R4760 multichannel photomultiplier using the Cockcroft-Walton HV system. Furthermore, the final readout electronics was used for both the presampler and the FCAL prototype modules.

The uranium radioactivity was used to set the relative gains of the calorimeter phototubes and 15 GeV electrons served to set the energy scale. Muons were used to calibrate the presampler. The combined response of the presampler and calorimeter was determined for electrons in the energy range from 3-50 GeV. The amount of material installed in front of the presampler varied between 0 and 4 radiation lengths (X) of aluminium. During these studies, the position of both calorimeter and presampler relative to the beam was fixed. A delay wire chamber allowed the determination of the impact point of the beam particles with an accuracy of 0.5 mm.

Most of the data were recorded with a defocussed beam about 10 cm in diameter, facilitating studies of uniformity and position dependence of the energy correction algorithms.

The uniformity of the presampler response to muons

Figure 11 shows the mean presampler response to 75 GeV muons. The position information was provided by the delay wire chamber. The presampler signals for the incident muons are normalized to the response at the center of the tile and averaged over uniformly populated rectangles of 90 x 5 mm. The nonuniformity in the sum of the two bordering tiles is a few percent in the regions of the fibers. In the horizontal direction (figure 11 b) the tiles are mounted within one cassette with no gaps between them. In the vertical coordinate (figure 11 c) a signal drop is observed between the cassettes due to the 1.4 mm gap between the scintillator tiles. The nonuniformity averaged over the surface of a tile is less than 1%.

figure 11 figure 12 figure 13
Fig. 11
The muon response uniformity of the presampler near tile borders. a) A sketch of scanning region, b) a horizontal scan (* represents the response of tile 6, that of tile 7 and the sum of both), c) a vertical scan, perpendicular to the embedded fibers. The dashed lines indicates the fiber positions. The data in both plots are averaged over a uniformly populated rectangle 90 x 5 mm in area with the long side perpendicular to the scanning direction.

The presampler response to electrons

The electron beam used for the energy correction studies was 1 cm wide and 10 cm high, centered horizontally within one FCAL module and vertically on one of the 20 x 5 cm electromagnetic sections. The presampler signal () was obtained by summing all 16 tiles in order to be sure to get the entire signal and because the electronic noise contribution was negligible. The signal from each tile was normalized to its average response to muons, resulting in units we refer to as ``MIP''. Aluminium plates of 3 cm thickness were used as the absorber material. In the following three such plates together are referred to as one radiation length, an approximation which is accurate to 1%.

As examples of the calorimeter and presampler signal spectra we show in figure 12 the energy distributions measured with the calorimeter () and the signal in the presampler for 25 GeV electrons for aluminium absorber thicknesses ranging between 0 and 4 X. The mean value for decreases by more than 20%but the shapes of the distributions remain approximately gaussian. The resolution deteriorates substantially in the presence of more than 2 X of absorber material.

figure 12
Fig. 12
Signal distributions in the calorimeter and presampler for 25 GeV electrons having passed through 0, 1, 2, 3, and 4 radiation lengths of aluminium absorber.

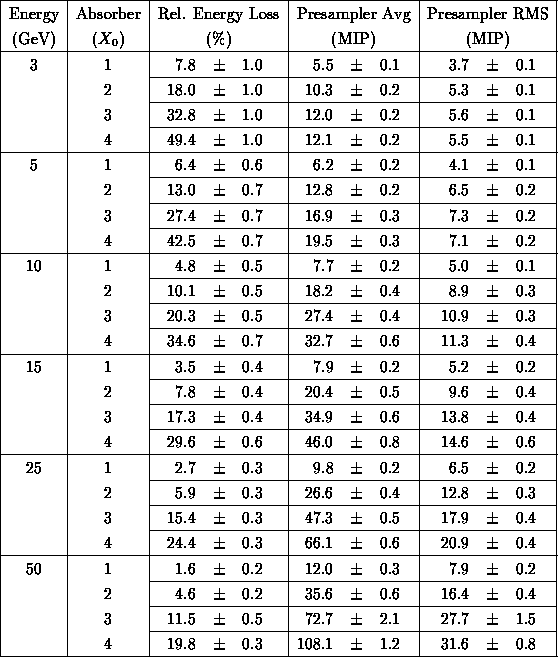
Table 1 shows the relative calorimeter signal loss and the average and RMS values of the presampler signal spectra for the full range of electron energies and absorber thicknesses. The uncertainties presented are dominated by the statistical precision.
*[3mm]

Table 1: The relative decrease in the calorimeter signal and the average and RMS values of the presampler signal spectra for each electron energy and each aluminium absorber thickness used in the test beam studies. The uncertainties shown are dominated by the statistical precision.

Contribution of backscattering to the presampler signal

The comparison of presampler signal spectra from incident muons with those of incident electrons allowed us to estimate the contribution of backscattering from the electromagnetic showers in the uranium calorimeter. Figure 13 shows this comparison for 5, 15, 25 and 50 GeV electrons. We determine the average relative increase to be 1.45, 1.65, 1.80, and 2.16 respectively, to an accuracy of 2%. By adding absorber upstream of the presampler and displacing both absorber and presampler several meters upstream to measure the decreased contribution from backscattering, we ascertained that the backscattering contribution is not increased by the presence of the absorber in front of the presampler. Thus we can be sure that the backscattering contribution remains at the level of 1 MIP and can be neglected at the level of 10%of the size of the signals we use for the electromagnetic energy correction. We also measured the backscattering contribution from hadronic showers and found for 15 and 75 GeV incident pions values for the average relative increase less than 1.5 and 2.0 respectively.

figure 13
Fig. 13
A comparison of the presampler signal spectra for 5, 15, 25, and 50 GeV electrons to that for muons. The smooth curve shows the response to muons. The presampler signal has been normalized to the average value of the muon spectrum. Each spectrum contains 2000 entries.

Electron energy correction

Figure 14 shows the correlation between the presampler signal (normalized to the average signal of a minimum-ionising particle) and the calorimeter signal for 25 GeV electrons as a function of the amount of absorber material.

figure 14
Fig. 14
Calorimeter versus presampler response for 25 GeV electrons and absorber material ranging from 1 to 4 X. The line represents the fit to the data according formula (1).

We have considered a variety of parametrisations for the relationship between calorimeter and presampler responses. In the well-defined environment of a test beam the correction is straightforward and depends on the incident energy and the amount of absorber material, both of which are precisely known.

figure 15
Fig. 15
Average calorimeter response normalized to the electron energy versus the electron energy before and after correction.

In a detector environment the amount of absorber material in front of the calorimeter is not uniformly distributed, arising from cables, support structures, etc. One can, however, identify regions where the average amount of absorber material is roughly known. For this reason we show here the result obtained with one set of correction constants common to the 1 and 2 X data set and one for the 3 and 4 X data set. The relation between the measured mean values of and has been parametrised in a linear approximation:

The result for the two data sets for 25 GeV electrons is shown in figure 14 . The parameters depend on the amount of material and on the electron beam energy. This correction algorithm allows for a linear energy dependence of the parameters : . We neglect the dependence on the amount of absorber material in order to estimate the success of the algorithm when the amount of absorber varies within the data sample. The parameters and are determined by minimising the difference of the beam energy and the corrected calorimeter signal,

figure 16
Fig. 16
Reconstructed energy distributions for 25 GeV electrons for a mixture of the 1-4 X data before and after application of the correction algorithm.

The results for the corrected calorimeter response for electrons in the energy range 3-50 GeV, are shown in figure 15 . This procedure provides a correction accurate to 3%for the energy range studied here, but for an overcorrection of about 10%for the 3 X data points at low energy. For electron energies greater than 5 GeV and for absorber thickness less than 2 X, the values relevant to the operation of the ZEUS detector, this simple correction algorithm yields a systematic precision of 2%.

The improvement in the energy resolution as well as in the energy scale is shown in figure 16 . The energy distribution of 25 GeV electrons for a merged 1-4 X data set is shown before and after correction.

Summary and conclusions

We have designed, built, installed and operated a scintillator-tile presampler for the forward and rear calorimeter of the ZEUS detector. The scintillation light from the tiles is collected by wavelength-shifting fibers and guided to multi-anode photomultipliers via clear fibers. The signals are shaped, sampled and pipelined in the manner employed for the calorimeter itself, easing the integration of the presampler in the ZEUS data acquisition system. The performance of the tiles and fiber readout were monitored with a cosmic-ray telescope and with collimated sources during production. The single-particle detection efficiency is greater than 99%and the response uniformity over the area of each of the 576 20 x 20 cm tiles is better than 5%. An LED flasher system and scans with radioactive sources have proven useful diagnostic tools since the installation of the presampler. The in situ calibration with minimum-ionising particles during the 1995 data-taking period achieved a precision better than 5%per tile. Test beam studies of a presampler prototype with the final geometry and readout in combination with a prototype of the ZEUS forward calorimeter verified the efficiency and uniformity results and allowed the determination of backscattering contributions. Tests with electrons were performed in the energy range 3-50 GeV with 0-4 radiation lengths of aluminium absorber. These studies have proven the feasibility of an electron energy correction accurate to better than 2%in the energy range and for the configuration of inactive material relevant to the ZEUS detector.

Acknowledgements

We would like to thank the technical support from the institutes which collaborated on the construction of the presampler, in particular W. Hain, J. Hauschildt, K. Loeffler, A. Maniatis, H.-J. Schirrmacher (DESY), W. Bienge, P. Pohl, K.-H. Sulanke (DESY-IfH Zeuthen), M. Gospic, H. Groenstege, H. de Groot, J. Homma, I. Weverling, P. Rewiersma (NIKHEF), R. Mohrmann, H. Pause, W. Grell (Hamburg), M. Riera (Madrid), R. Granitzny, H.-J. Liers (Bonn). We are also grateful for the hospitality and support of CERN, in particular the help of L. Gatignon is much appreciated. Finally we would like to thank R. Klanner for his enthusiastic support during all phases of the project.

References

1
The ZEUS Detector, Status Report, DESY (1993).
2
A. Andresen et al. Nucl. Instrum. Methods A309 (1991) 101.
3
A.Weisenberger et al., Nucl. Instrum. MethodsA327 (1993) 500.
4
A Remote-Controlled High Voltage system for PMT's. M.Gospic, H.Groenstege, NIKHEF-ETR 94-11
http://www.nikhef.nl/www/pub/et/zeus/presampler/presampler.html
L. Hubbeling, CERN-EP Internal report 78-5.

5
A.Caldwell et al., Nucl. Instrum. Methods A321 (1992) 356.
6
B.Krebs et al., Nucl. Instrum. Methods A323 (1992) 611.
7
U.Behrens et al. Nucl. Instrum. Methods A289 (1990) 115.
A.Andresen et al. Nucl. Instrum. Methods A290 (1990) 95.
Studies of Particle Jets with an Interaction Trigger, W.Kröger, Ph.D. Thesis, University of Hamburg, 1992.
8
A Prototype Presampler for Uranium-Scintillator Calorimeter in ZEUS, H.Grabosch et al., NIKHEF-H/93-11.
9
Calibration of the Presampler for the Electron Energy Measurement in the ZEUS Detector, A.Bornheim, Diploma Thesis, Bonn IB 95-24 (1995) (in German)
10
Shaping Amplifier for PMT signals for ZEUS, P.Rewiersma, I.Weverling, NIKHEF-ETR 94-12.

About this document ...

This document was generated using the LaTeX2HTML translator Version 0.5.3 (Wed Jan 26 1994) Copyright © 1993, Nikos Drakos, Computer Based Learning Unit, University of Leeds.