SPEAR EPICS
Pulse Signal Monitor
Description
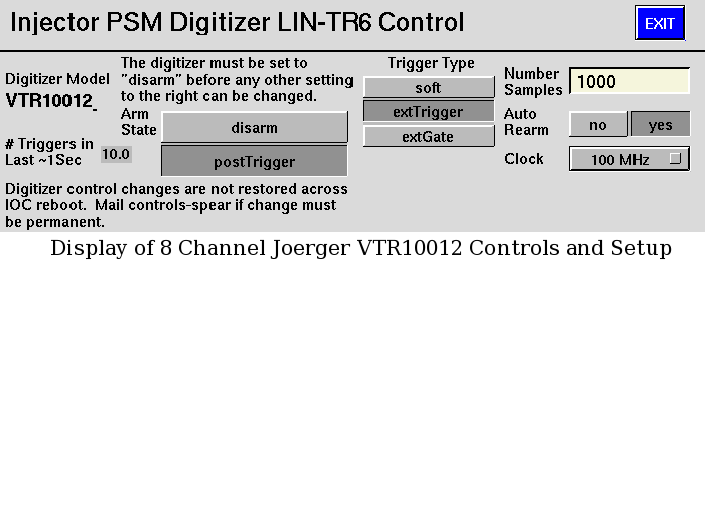
The pulse signal monitor (PSM) system provides various injector and SPEAR waveforms, such as GT1 and GT2 currents and klystron forward and reflected powers, to the SPEAR control system. The signal list is provided in the "Booster Pulsed Signals" and "Linac Pulsed Signal" tabs in the PSM spreadsheet by John Schmerge. The linac PSM digitizer channels (spreadsheet) and booster PSM digitizer channels (spreadsheet) and are documented in detail by John Wachter.The signals are connected to Joerger VME VTR10012 (Manual), VTR10014 (Manual), and VTR812 (Manual) digitizers and are read in by the injector and SPEAR IOCs, including ioclinac in crate 140-VME1, iocboo1 and iocboo2 in crate 140-VME3, iocbpm in crate 140-VME4, and iocps in crate 118-VME1.
Each digitizer has up to 8 channels, one trigger, and one optional clock. The 7 linac VTR10012 digitizers, 3 transport line BPM sum VTR10014 digitizers, and 1 SPEAR kicker VTR10014 use the internal clock set at 100MHz, the first booster VTR812 digitizer (for Q-meter acquisition) uses a 33kHz external clock, and the 3 remaining booster VTR812 digitizers use a 10kHz external clock. The triggers for the digitizers come from these delay generators:
- LIN-DG4 - linac and LTB signals triggered all the time.
- BTS-DG2 - booster and BTS signals triggered all the time.
- 118-DG2 - SPEAR kicker signals triggered only during SPEAR injection.
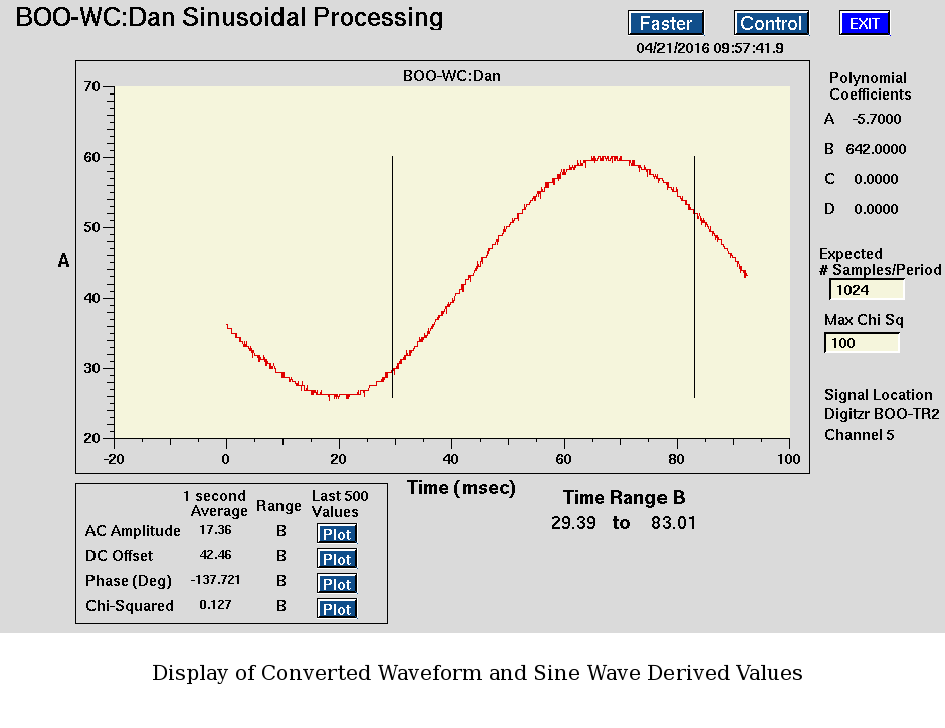
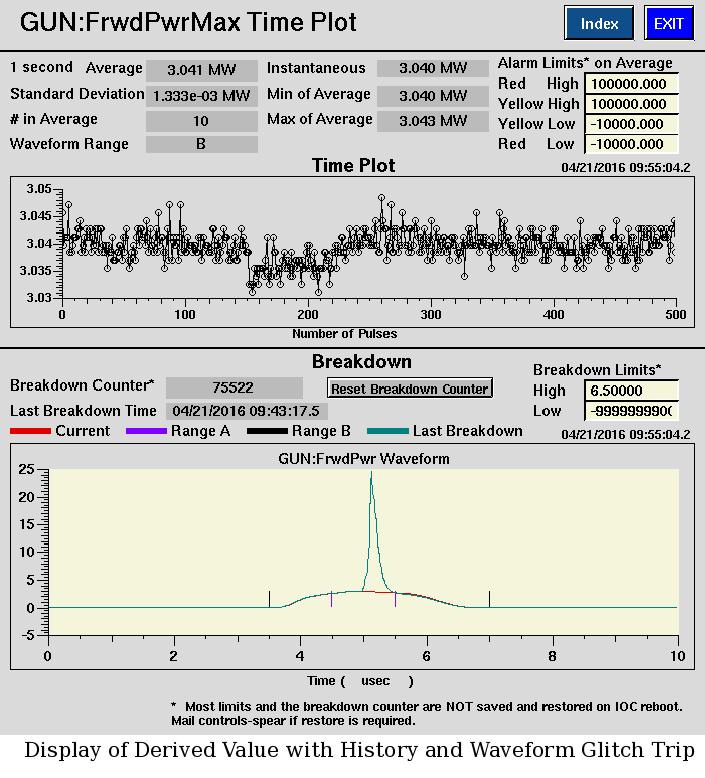
The IOC software, using the generic transient recorder package from APS, reads in waveforms on interrupt from the digitizer and processes them using subroutines in $EPICS/modules/spearUtils/spearUtils/devPsm /subpsm.c. The waveforms are converted from counts to volts and engineering units, and then reduced to various single values such as peak, pulse width (such as a second moment), and integral. All waveforms and processed values are available at both the trigger rate and 2Hz which is the default used in most displays to reduce network load. The conversion from counts to voltage includes a voltage offset which is settable by the user. The conversion to engineering units uses a polynomial with 4 terms where the polynomial coefficients are settable by the user.
The following algorithms, specified in the "Calculations" tab of the PSM spreadsheet, are implemented for waveform reduction using two ranges (A and B), each range containing a high and low time limit that are settable by the user.
- Minimum
- Maximum
- Summation
- Simple Average
- Standard Deviation on the Simple Average
- Integral
- Centroid
- Time Width
- Leading Edge
- Trailing Edge
- Amplitude of the Centroid
- RMS of the Amplitude of the Centroid
- DC Offset
- Amplitude
- Phase
- Chi-Squared Distribution
All calculated parameters are time-averaged where the number of values in the average is set in the database per parameter per waveform. Even though parameters for both ranges are calculated (except for sine wave processing which is only done for range B), only one of the two parameters is stored in history buffer where the range selection is set in the database per parameter per waveform.
Macro substitution files for records (linac, booster1, booster2, SPEAR kickers, transport line BPM sum) are $EPICS/app/PowerSupply/prod/bitPSCApp/Db/linacDiag.substitutions, boosterDiag.substitutions, and spearDiag.substitutions, and $EPICS/app/BPM/prod/transBpmApp/Db/transBpmSum.substitutions. The record databases (shared between bitPSCApp and transBpmApp IOC applications) are $EPICS/modules/spearUtils/spearUtils/devPsm/*.db. The SPEAR EPICS PV Database web page is used to add records to history.
Operator Interface
The PSM EDM displays include:


Contact (Physics Content): John Schmerge
Contact (Web Page): Stephanie Allison
Last Modified: Apr 21, 2016