Window with HippoDraw Qt widget.
The HippoDraw's sihippo Python extension module is used with PyQt. Thus it uses the SIP tool to built the Python extension module. Modules built with SIP are not compatible with those built with SWIG or Boost.Python.
A complete HippoDraw application written in Python can be as simple as this...
> python
Python 2.2.3 (#1, Jun 21 2003, 08:34:26)
[GCC 3.2.2 20030222 (Red Hat Linux 3.2.2-5)] on linux2
Type "help", "copyright", "credits" or "license" for more information.
>>> import sys
>>> from qt import *
>>> app = QApplication ( sys.argv )
>>> from sihippo import *
>>> window = CanvasWindow()
>>> window.show()
>>> app.exec_loop()
This produces the equivalent of the HippoDraw stand-a-lone application.
With this release, Not all of HippoDraw's C++ library has been exposed to Python. Although this could be done, as was done with PyQt, it is not believed to be necessary. Rather, selected high level components have been exposed. More can be exposed in future releases as needed.
It is perhaps more interesting to add the HippoDraw to an existing application. This can be done by using a HippoDraw display as a Qt widget, or by adding a canvas window and Inspector to an existing application.
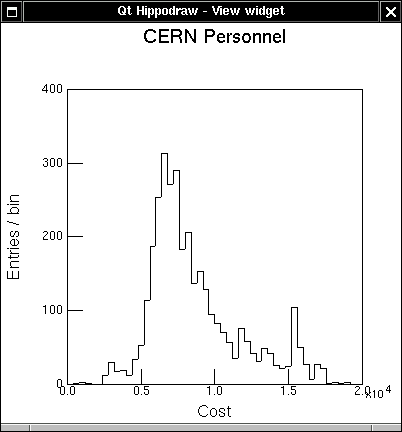
The testwidget.py file in the sip subdirectory demonstrates using HippoDraw library as a Qt widget. Its contents is...
import sys
from qt import *

app = QApplication ( sys.argv )

from sihippo import *

ntc = NTupleController.instance()
nt = ntc.createNTuple ( '../../hippodraw/examples/aptuple.tnt )

dc = DisplayController.instance();
plotter = dc.createDisplay ( "Histogram", nt, [ 'Cost' ] )

view = QtViewWidget()
view.setPlotter ( plotter )

view.resize ( 400, 400 )
app.setMainWidget ( view )
view.setCaption ( "Qt Hippodraw - View widget" )
view.show()

app.exec_loop()
Note that the HippoDraw library interface with SIP mirrors the C++ interface. Also since calls to these member functions are being done from the same thread as the one that Qt QApplication object created, no locking or unlocking of the application is needed.
The results looks like this...
Window with HippoDraw Qt widget.
At SLAC, a data acquisition system was built entirely with Python and PyQt. HippoDraw was added to it to display the collected data. The run control panel is initialized in its startup member function like this...
import sys
from qt import *
from sihippo import *

import RunControl as rc

def startup():
  # Start up run control
  app    = QApplication(sys.argv)
  QObject.connect(app, SIGNAL("lastWindowClosed()"), app, SLOT("quit()"))

  canvas = CanvasWindow()
  canvas.show()

  runCtl = rc.RunControl()
  app.setMainWidget(runCtl)
  runCtl.show()

  app.exec_loop()
The result is a run control panel, a HippoDraw Canvas Window Users Guide and the HippoDraw Inspector Users Guide. Elsewhere, this example application creates two empty one column NTuples to monitor the run. The code looks like this
    label1 = ['Strip Hits']
    label2 = ['Event Size']
    ntc = NTupleController.instance()
    self.__nt = ntc.createNTuple(1)
    self.__nt2 = ntc.createNTuple ( label2 )
    self.__nt.setTitle('Event Readout #1')
    self.__nt2.setTitle('Event Readout #2')
    self.__nt.setLabels(label1)
    self.__nt.reserve ( 512 )
    self.__nt2.reserve ( 512 )
Later in this application's code, two displays are created like this...
    wc = WindowController.instance()
    canvas = wc.currentCanvas()
    dc = DisplayController.instance()
    hist = dc.createDisplay ( 'Histogram', self.__nt, label1 )
    hist2 = dc.createDisplay ( 'Histogram', self.__nt2, label2 )
    canvas.addDisplay(hist)
    canvas.addDisplay(hist2)
    self.__nt.setIntervalCount ( 500 )
    self.__nt2.setIntervalCount ( 100 )
Again, the SIP built interface mirrors the C++ interface. At this point we have displays attached to an empty ntuples. As the ntuples get filled. they send an Observer::update message to their observers. This will cause the displays to be refreshed. The NTuple::setIntervalCount slows down the refresh rate so that application can spend more time collecting data. The first ntuple sends the update message only for every 500 updates of the ntuple, while the second only 100 updates.
The startRun member function looks like this...
    self.__nt.clear()
    self.__nt2.clear()
    wc = WindowController.instance()
    canvas = wc.currentCanvas()
    canvas.setIntervalEnabled ( 1 )
    cnt = self.__arg.getValue("Enter number of triggers to take")
The ntuples are cleared at the beginning of a run. The interval counting is enabled by calling CanvasWindow::setIntervalEnabled member function. It forward the enabling message to all the ntuples that have displays in the window. At the end of the run, interval counting will be turned off so that the displays will refresh to the current state of the ntuple.
The event processing is not very interesting but looks like this...
  def process(self, buffer):
    "Method called back for each data event taken"

    self.evtCli.evDumpTKR()
    for stripData in self.evtCli.evt.TKRstrips:
      self.__nt.addRow([stripData.ui])
    self.__nt2.addRow([self.evtCli.evt_size])
Thus, the ntuples are built row by row. This applications collects about 80 events per second. With the interval counting enabled, the histograms still refresh about once a second. Without interval counting, the event rate would be cut in half, because the application would be spending so much time drawing new histograms.