SLAC CPE Software
Engineering Group

| System Admin |
SLCNET Problem |
| SLAC Detailed |
| SLAC Computing |
| Software Home |
| Software Detailed |
|
SLAC CPE Software
Engineering Group |
||||||||||
|
|
|
|
||||||||
Programmers' Guides, Users' Guides
Solution:
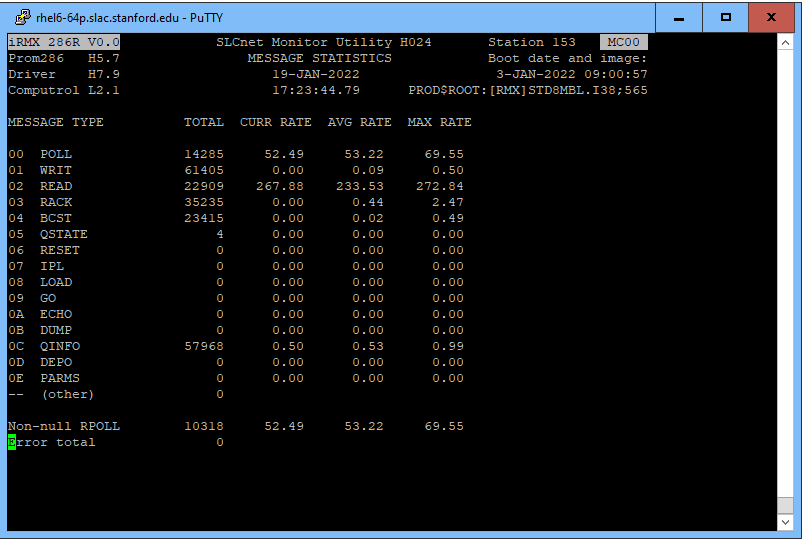
Siskind: My network analyzer is saying that there is a ton of NOWRITE errors coming out of MC00 – all from attempts to read job 15. If I run DISP86 on that micro, it’s showing ~250 Hz of READs with virtually no RACKs.
Can you try re-IPLing it? Or maybe just kill its power and see what happens? I’m just wondering whether the rate of these NOWRITE errors is so high that it’s resulting in errors in putting the entries into the control system error log. --- I looked through more than a hundred READs with zero-length replies. All of them were to job 15 on MC00, which is on gateway 1. Maybe it and it alone is sending the spurious SLCNet interrupts to DBEX, and somehow the error log is messing up because of the high rate of errors. ---- Miller:
I've looked a bit at ERRLOG for /SOUR=MC00.
There is an exceptional message pair logged at 14-JAN-2022 10:20:31, (the first NOWRITE is at 10:20:32):
14-JAN-2022 10:20:31 %MICR-W-ETIME, MC00 Time limit expired 14-JAN-2022 10:20:31 %DATABASE-E-CANTSEND MC00 DB supertype 3 update may fail to reach Alpha. subjob ANLG (This is first block of entries below.)
The failure of the analog job (as evidenced in many messages) doesn't start until 2 days later, following a crash in micro code.
(This is second block of entries below.)
=============================================================================================================
14-JAN-2022 08:41:08 %TIME-E-MBTIMEOUT, MC00 25 more errors in last 20 minutes 14-JAN-2022 08:41:46 %TIME-E-PPDU_NO476, MC00 21 more errors in last 21 minutes 14-JAN-2022 09:01:51 %TIME-E-MBTIMEOUT, MC00 29 more errors in last 20 minutes 14-JAN-2022 09:02:46 %TIME-E-PPDU_NO476, MC00 21 more errors in last 21 minutes 14-JAN-2022 09:20:39 %TIME-E-PNETGARBL, MC00 330 more errors in last 40 minutes 14-JAN-2022 09:22:01 %TIME-E-MBTIMEOUT, MC00 27 more errors in last 20 minutes 14-JAN-2022 09:23:46 %TIME-E-PPDU_NO476, MC00 21 more errors in last 21 minutes 14-JAN-2022 09:42:37 %TIME-E-MBTIMEOUT, MC00 20 more errors in last 20 minutes 14-JAN-2022 09:44:46 %TIME-E-PPDU_NO476, MC00 21 more errors in last 21 minutes 14-JAN-2022 10:01:13 %TIME-E-PNETGARBL, MC00 289 more errors in last 40 minutes 14-JAN-2022 10:04:52 %TIME-E-MBTIMEOUT, MC00 26 more errors in last 22 minutes
--- Siskind: The DISP86 output for MC00 which I screen captured a few emails earlier in this thread indicated that MC00 has not been booted since 3-Jan-2022 at 09:00:57. In general, I thought that micros are NOT reboot when the control system is restarted. It seems quite likely that when the database job in that micro is trying to send to DBEX in the Alpha, its job number is corrupted. Instead of the SLCnet interrupt asking DBEX to read job 19 in MC00, the interrupt is asking DBEX to read job 15 in that micro. I thought that I looked at the database job code a couple of days ago, and there was a variable called myjobnum or something like that which provides that information. Here is the relevant code in dbmain: myjobnum = FUNC_DB >> 8; if (!SUCCESS(iss = msg_init1(&MSGMAILDBM, &myjobnum, "DBS "))) stop(&iss); Here’s the value of FUNC_DB which provided a few days ago. FUNC_DB literally '1300H', So if the variable where the msg package holds this information is corrupted (it may actually be down in the driver for the Computrol board) is corrupted, then that would account for the observed behavior.
--- Harms:
OK good news - I just reset the micro MC00 and lo and behold... the error stream ceased. After reboot the errors are no longer streaming by, it looks like this fixed it.
If this happens again, I'll try an IPL-all to see if any of the micros are causing it.
|
|
Emails concerning a SLCNET problem:
We have been getting 20 errors a second: Ed has tried to warmslc dbex and then a control system bounce.
Any ideas? The errors are overwhelming our system.
14-JAN-2022 17:07:59 %SLCNET-E-NOWRITE, V018 no matching write at remote node TA03 job # 15 on Read
14-JAN-2022 17:07:59 %SLCNET-E-NOWRITE, V018 no matching write at remote node TA03 job # 15 on Read
14-JAN-2022 17:07:59 %SLCNET-E-NOWRITE, V018 no matching write at remote node TA03 job # 15 on Read
14-JAN-2022 17:07:59 %SLCNET-E-NOWRITE, V018 no matching write at remote node TA03 job # 15 on Read
14-JAN-2022 17:07:59 %SLCNET-E-NOWRITE, V018 no matching write at remote node TA03 job # 15 on Read
14-JAN-2022 17:07:59 %SLCNET-E-NOWRITE, V018 no matching write at remote node TA03 job # 15 on Read
14-JAN-2022 17:07:59 %SLCNET-E-NOWRITE, V018 no matching write at remote node TA03 job # 15 on Read
The basic problem seems to be that Alpha jobs (such as dbex) are getting told that a poll response from a micro is yielding an interrupt from a micro job when that micro job isn’t trying to send a message to that Alpha job. Are all of the micros generating this error on the same gateway? If so, then it might be a hardware failure in that gateway.
believe they are all on the same gateway. Here is the .RTE file:
MCC::ESM> TYPE SYS$COMMON:[DRIVERS]QSUD0.RTE
MC00 8001 MP00 8001 LI00 8001 LI01 8001 LI02 8001 LI03 8001 LI04 8001 LI05 8001 LI06 8001 LI07 8001 LI08 8001 LI09 8001 LI10 8001 LI11 8001 LI12 8001 LI13 8001 LI14 8001 LI15 8001 DR01 8001 DR02 8001 DR03 8001 CA01 8001 CA02 8001 CA03 8001 FF01 8001 FB31 8001 FB69 8001 EP01 8001 EP05 8001 LC00 8001 CB00 8001 CB01 8001 CB02 8001 TA01 8001 TA02 8001 AM00 8001 PR00 8002 PR02 8002 PR03 8002 PR04 8002 PR06 8002 PR08 8002 PR10 8002 PR12 8002 PI01 8002 PI11 8002 BD01 8002 TL01 8002 N254 F000
That seems to make sense, as what is going on is that gateway 0 is flooding the backbone with messages to the PCIL of the “I have a non-null poll response for you” variety. This means that when gateway 1 has a non-null message of that type, it has to wait until the PCIL finishes responding to the last message from gateway 0. While gateway 1 is waiting to get its message through to the PCIL, it stops polling. Actually, each gateway runs two identical copies of its polling process. These share common hardware in the FPGAs on the gateway board to send its messages of this type, so there’s a mutex in the gateway code which the two copies of the polling process utilize to determine which one gets to use that common hardware. However, if the backbone is sufficiently constipated both copies of the polling process can stall – one owning the mutex and waiting for the PCIL to respond, and the other waiting for the mutex. The basic idea remains that if gateway 0 is hogging the backbone, it can slow down polling on other gateways. This makes it more interesting that BIVSC isn’t reporting a low poll rate on gateway 0. That in turn suggests that the backbone messages from gateway 0 are spurious – they’re coming from the FPGAs without the code in that gateway requesting them (which is what I’ve been suspecting).
We do have a tool for analyzing the system error log. We run it once a day and save the output in a daily file.
I have looked at those files and see nothing logged except the activity associated with the system boot Friday night.
I can tell you where to look at these procedures and results on MCC.
In order for the logical names I use to work for you, first execute
$ @slcmgr_dir:watchdog_login (suggest you put it in your LOGIN.COM for the future).
The output from running the daily procedure are in MGR_WATCHDOG:SYSERRLOG.REC;* (a new version once a day) there is also a "brief" version of this info in
MGR_WATCHDOG:SYSERRLOG_BRIEF.REC
The command files that produce those daily files are MGR_WATCHDOG:SYSERRLOG.COM and SYSERRLOG_BRIEF.COM
What this really boils down to is that DBEX in the Alpha is receiving SLCNet interrupts from various micros on gateway 0 indicating that VEREX in those micros has a message to send to DBEX. When DBEX tries to read those messages from VEREX in the various micros, VEREX says that it has nothing to send to DBEX. Recall that the vast majority of SLCnet traffic consists of the DB job in the micros sending data to DBEX in the Alpha. It would seem that there’s a reasonable likelihood that the byte in the SLCNet interrupt message which indicates which job in the micro has a message for the Alpha is getting corrupted at some point. That byte is received by code in the gateway as part of the response to its poll of a micro. The poll response message is read out of the gateway’s SDLC chip and loaded into RAM in the gateway. From there, code in the gateway copies a word (containing the micro job number and the SLCnet interrupt number) into a register in one of the gateway FPGAs. It also loads a word (containing the micro’s SSA in the low byte and a zero in the high byte) into the next register in that FPGA. It then signals the code in the PCIL board to read those registers and set a response flag in that gateway FPGA when the register read is completed. That response flag signals the copy of the polling task in the gateway to resume.
|
|
[SLAC CPE Software Engineering Group][ SLAC Home Page]
Modified:
20-Jan-2022
Created by: Ken Brobeck Jan 17, 2022