
Fermi LAT Performance |
This page summarizes the top-level performance of the Fermi-LAT observatory that are currently used by the collaboration for science analysis and are available to the general public.
The LAT performance is governed primarily by three things:
- LAT hardware design
- Event reconstruction algorithms
- Background selections and event quality selections
A result of the analysis is the production of full Instrument Response Functions (IRFs), describing the performance as a function of photon energy, incidence angle, conversion point within the instrument, and other important parameters.
Pass 8 Release 2 Version 6 Instrument Response Functions
The plots below represent the work of many people in the LAT team. They correspond to the status of the analysis known as P8R2_V6, which has been optimized for the study of point-like sources and the production of the third LAT source catalog (3FGL).
These IRFs are based the new event analysis and selection criteria described in the paper: Pass 8: Toward the Full Realization of the Fermi-LAT Scientific Potential.
The P8R2 data set was reprocessed from scratch. There are many differences in the way the Pass 8 data was selected and events reconstructed. See the following pages for more details:
The event analysis and selection criteria used for Pass8, like Pass7 and P7REP, take into account effects measured in flight that were not considered in pre-launch performance estimates. There is a completely new handling of pile-up and accidental coincidence effects in the detector subsystems leaving ghost signals in the detector in coincidence with good photon triggers. This new reconstruction recovers many events.
Important caveats are associated with these IRFs and should be kept in mind when performing analysis of the publicly distributed Fermi-LAT data.
Performance plots
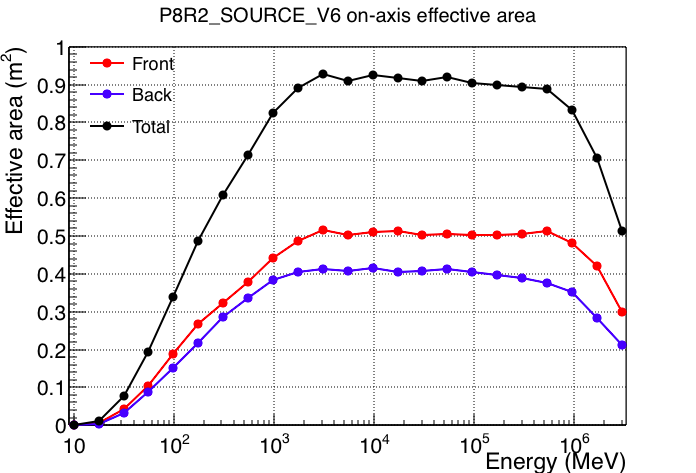
The LAT response functions define the response of the instrument to gamma rays of a given energy and arrival direction in instrument coordinates. Each event class is defined by a set of event selections and has a corresponding set of response functions that are unique to that class. The response functions for each class are internally partitioned into FRONT and BACK conversion types. Starting from the front of the instrument, the LAT tracker (TKR) has 12 layers of 3% radiation length tungsten converters (THIN or FRONT section), followed by 4 layers of 18% r.l. tungsten converters (THICK or BACK section). These sections have intrinsically different PSF due to multiple scattering with the PSF for FRONT events being approximately a factor of two better than the PSF for BACK events.
Pass 8 introduces a generalization of the conversion type classification in the form of event types. In addition to the conversion type partition, Pass 8 defines two additional partitions:
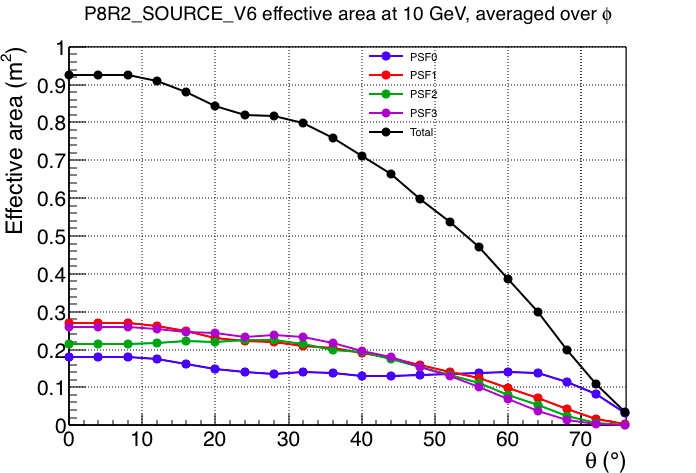
- PSF event type: using an event-level quantity indicating the quality of the reconstructed direction, the data is divided into quartiles, from the lowest quality quartile (PSF0) to the best quality quartile (PSF3)
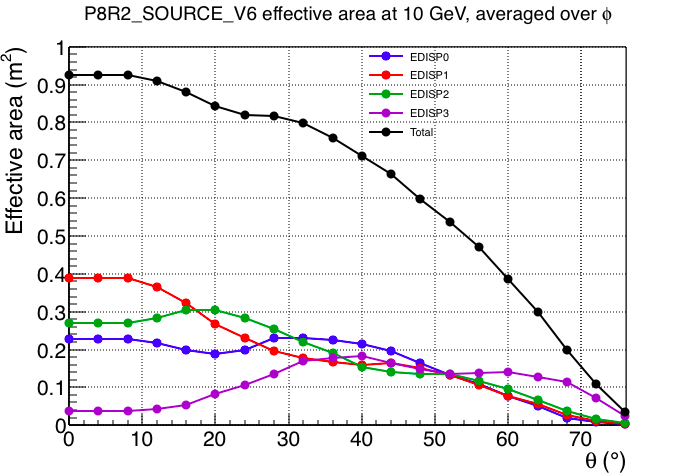
- EDISP event type: same as PSF except that the event-level quantity used to partition the data indicates the quality of the energy reconstruction.
In this page plots are provided for the standard FRONT/BACK partition as well as the PSF and EDISP event type partitions.
Note: the following plots are produced via the interface to the tabulated IRF values used internally by the LAT science tools. When plotted versus the energy of the incident photons, the response functions are sampled in 4 points per energy decade, which are clearly indicated on the plots and smoothly connected for graphical clarity. Similarly, suitable sets of sampling points are used for plotting specific IRFs vs. theta or phi. As a consequence, we warn against using the values derived from the figures below for any numerical evaluation of the LAT performance.
Effective area
The plots below are:
- the effective area as a function of energy for normal incidence photons (θ=0);
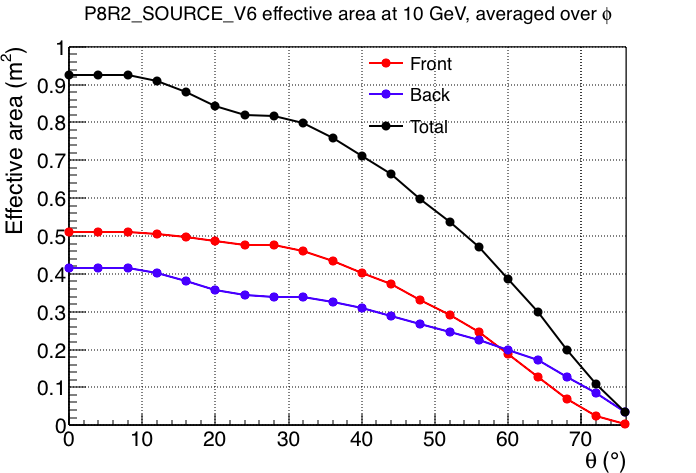
- the effective area as a function of incidence angle theta for 10 GeV photons;
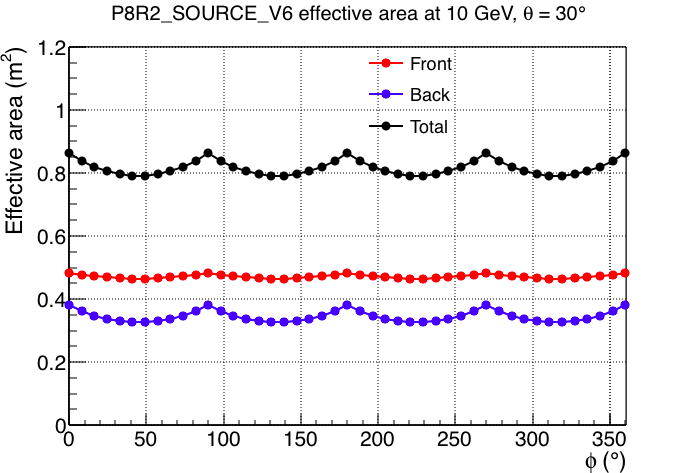
- the effective area as a function of the azimuthal angle phi for 10 GeV photons, 30 degrees off-axis;
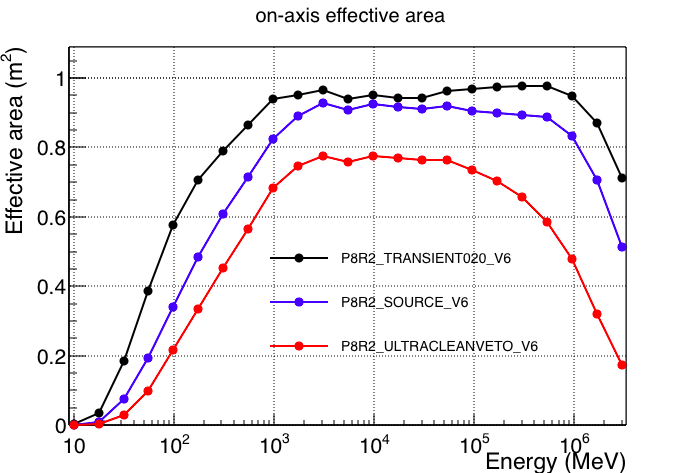
- comparison of the on-axis effective area (as a function of the energy) for different P8R2_V6 event classes (Total).
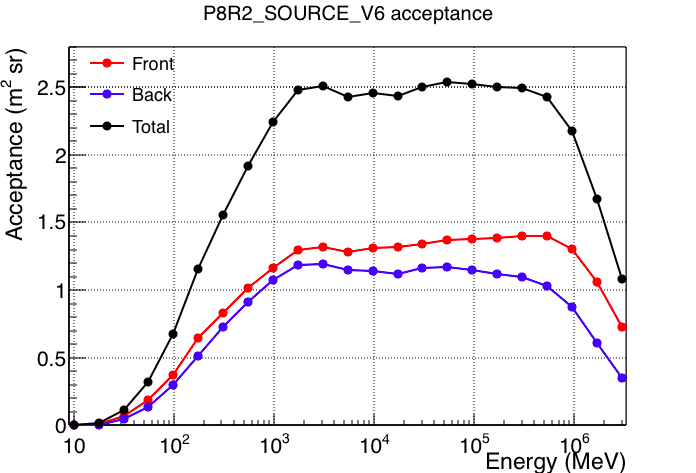
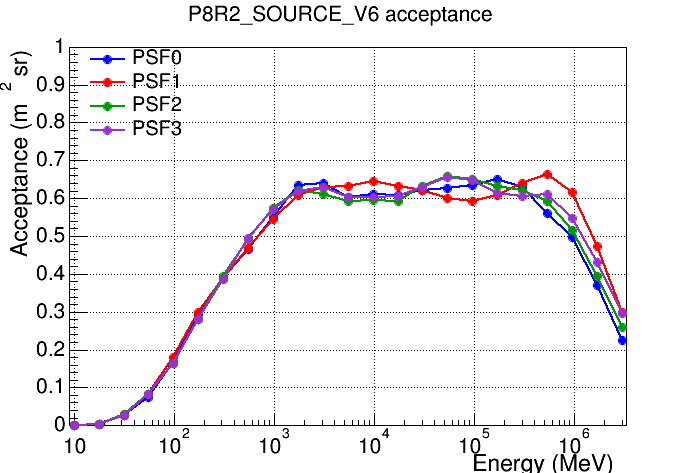
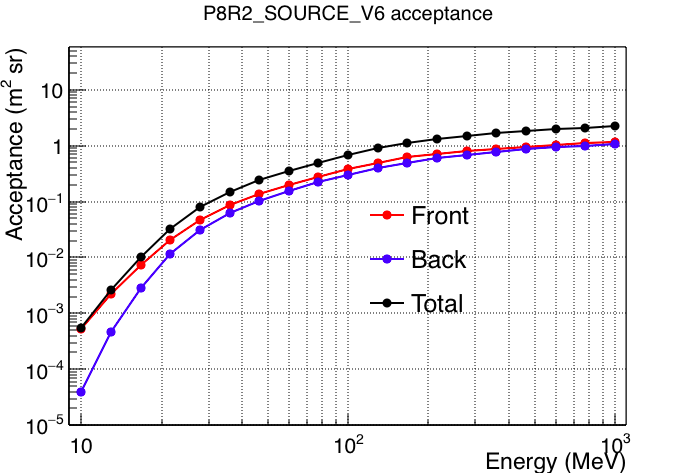
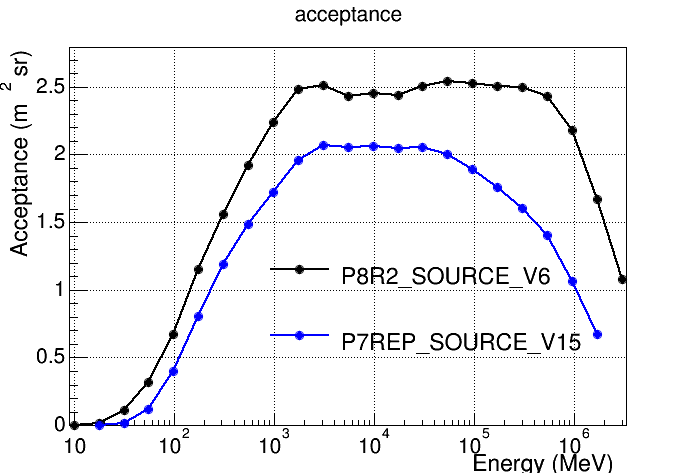
Acceptance
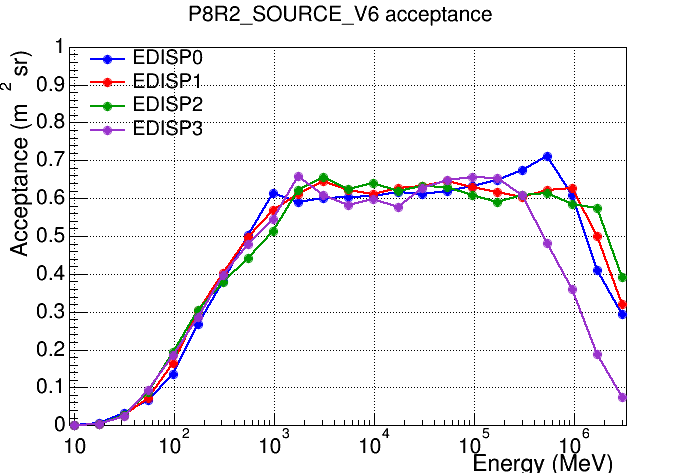
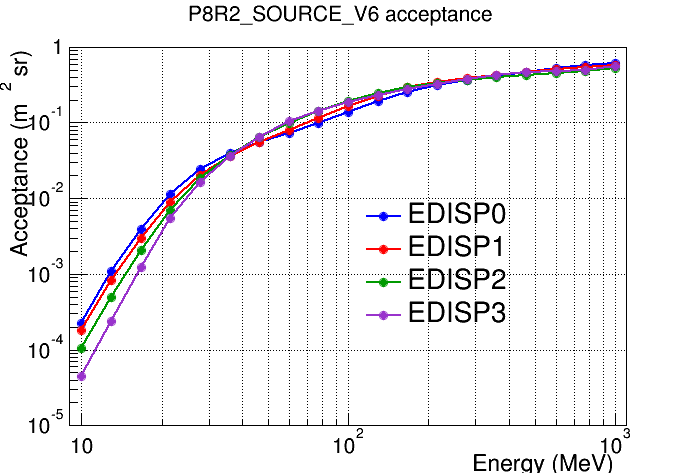
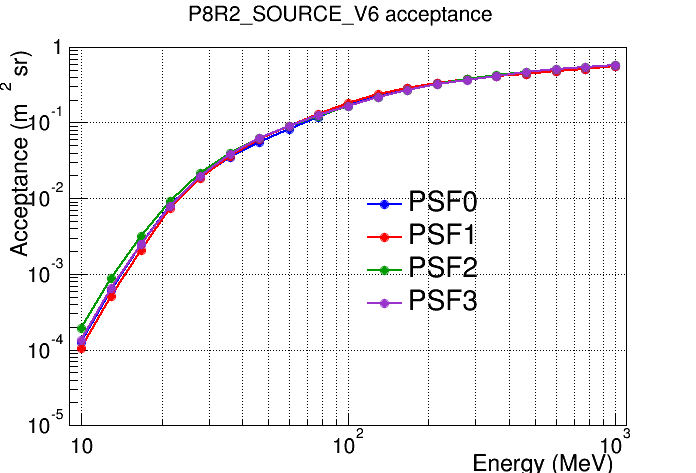
Defined here as the effective area integrated over the solid angle. Notice that the acceptance has a slower turn-on with respect to the effective area, highlighting the dependence of the FOV on energy. That is the intrinsic acceptance regardless of the orbital characteristics. To obtain the effective acceptance, the curve has to be scaled by a constant factor which takes into account the instrument deadtime; the South Atlantic Anomaly (SAA), where the LAT does not take data; and details of the observation strategy (about 20% for standard survey and according to current simulations).- the acceptance of P8R2_SOURCE_V6 as a function of energy for all events (Total) and the FRONT/BACK, EDISP, and PSF event types
- comparison of the acceptance (as a function of the energy) for different P8R2_V6 event classes (Total).

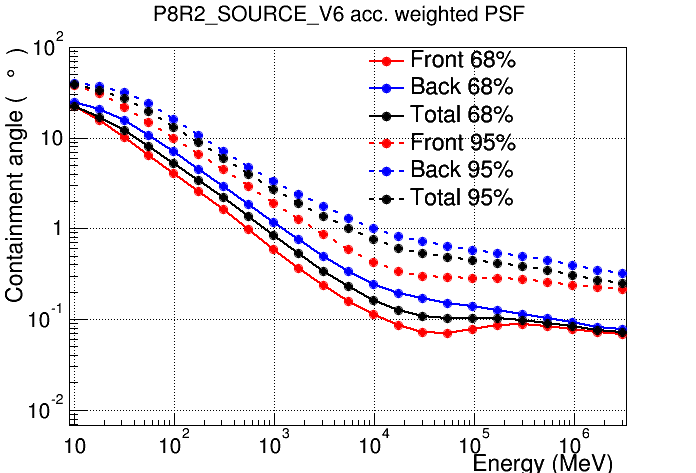
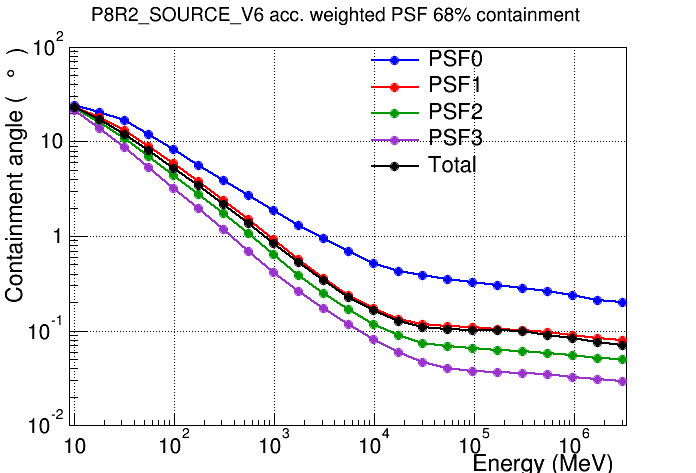
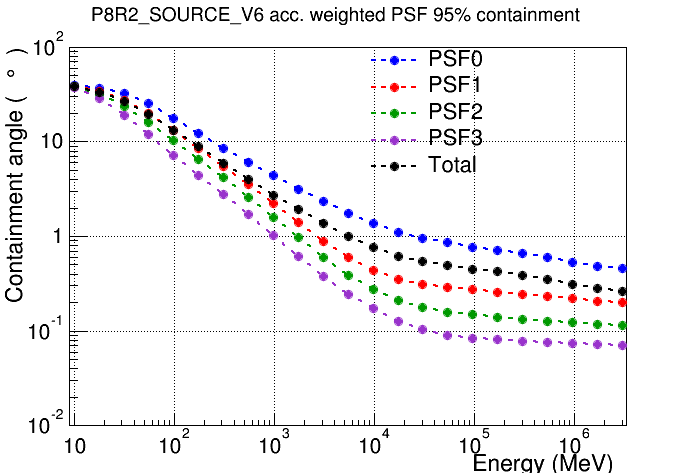
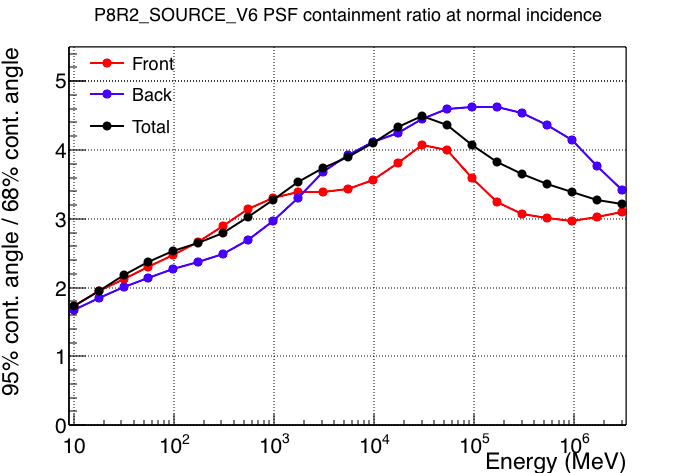
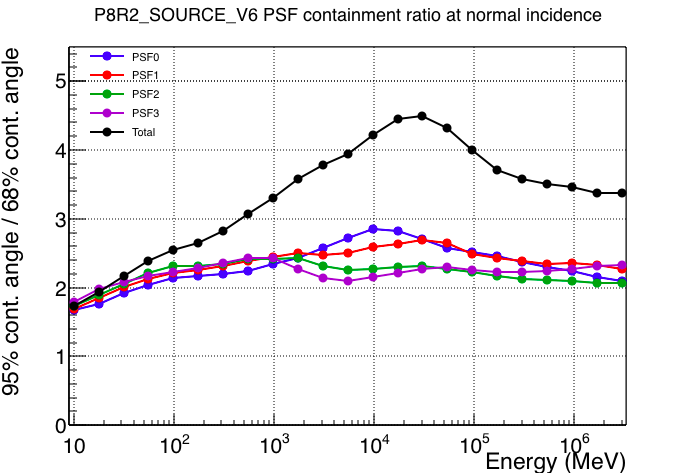
Point Spread Function (PSF)
In the P8R2_V6 response functions the PSF is derived entirely from Monte Carlo simulations. The dependence on the off-axis angle is included.
The plots below are:
- 68% and 95% containment angles of the acceptance weighted (acc. weighted) PSF for both the front/back and PSF event types;
- the ratio PSF95% / PSF68%, which is a useful indicator of the magnitude of the tails of the distribution.
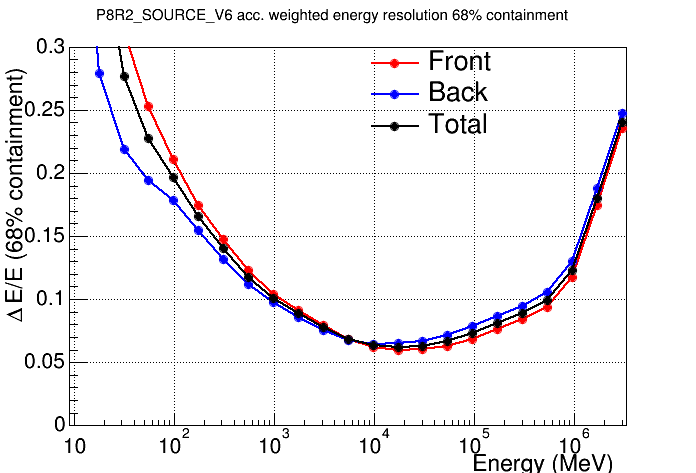
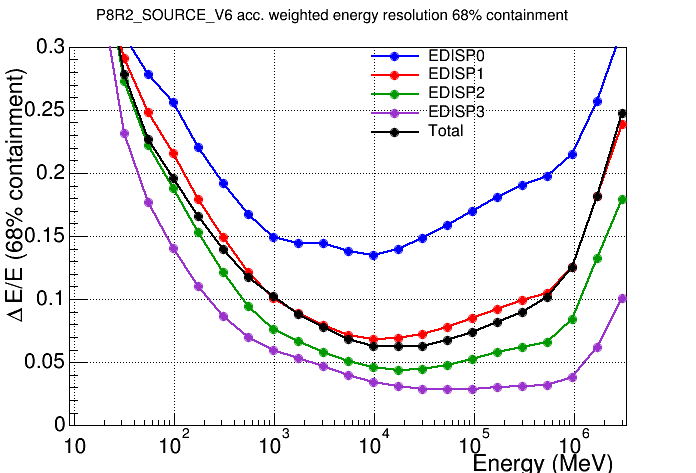
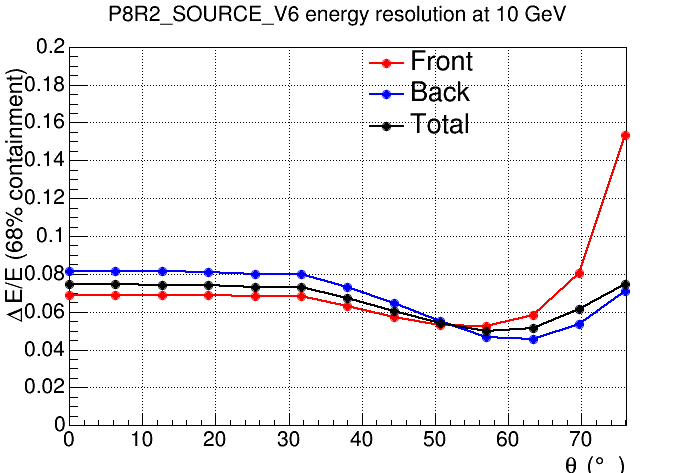
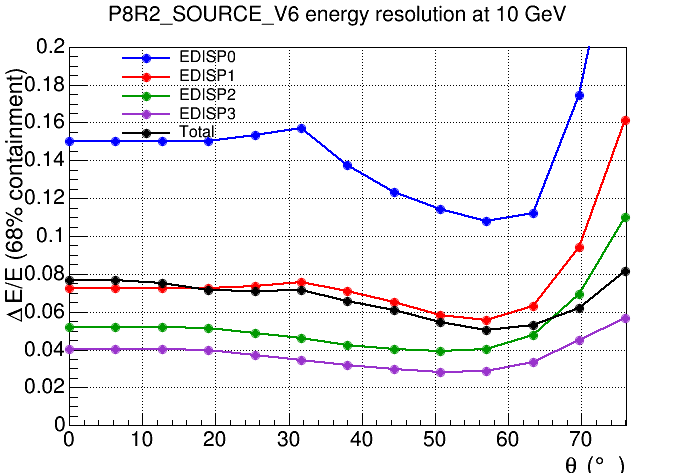
Energy resolution
The plots below are:
- Acceptance weighted (acc. weighted) energy resolution (i.e. 68% containment half width of the reconstructed incoming photon energy) as a function of energy;
- energy resolution as a function of incidence angle for 10 GeV photons.
Sensitivity Plots
Using the above instrument performance characterization, we have produced additional plots related to point source sensitivity.
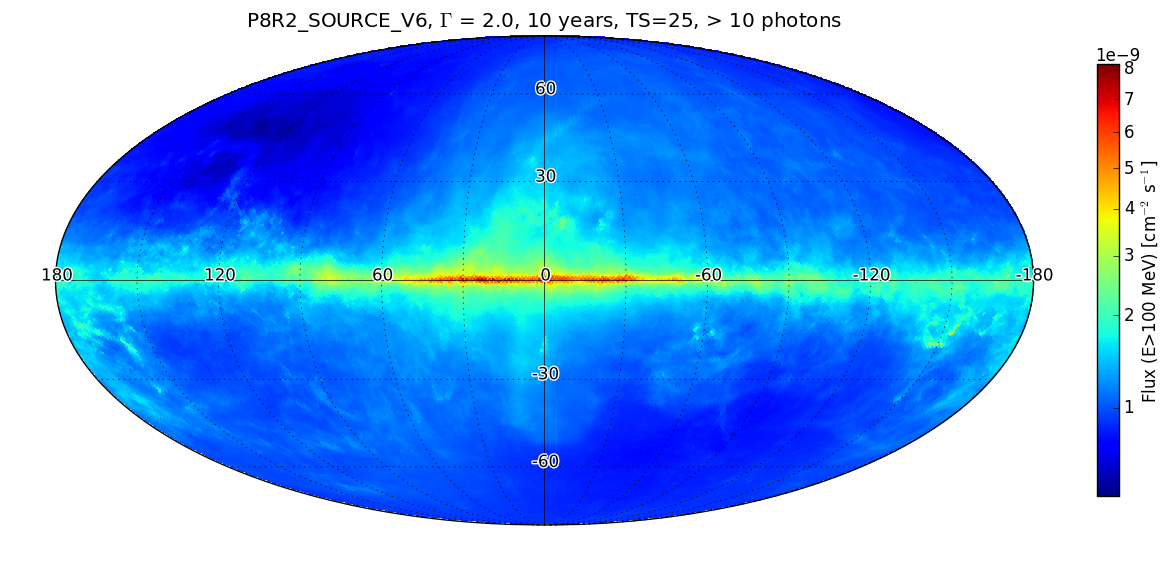
Point source sensitivity
The first plot shows the P8R2_SOURCE_V6 ten-year integral flux sensitivity for an isolated point source. The integral sensitivity is evaluated as the minimum flux above 100 MeV (in ph cm-2 s-1) to obtain the 5-sigma detection in 10 years of observation in survey mode, assuming a power law spectrum with index 2. Quantitatively, the 5-sigma limit is taken as the likelihood test statistic of 25 and at least 10 photons. The sensitivity calculation is based on an exposure map from the first five years of the mission (August 2008-August 2013) produced with a zenith angle cut of 100 degrees and the standard gtmktime filter selection (DATA_QUAL>0 && LAT_CONFIG==1). The 5-year exposure map is multiplied by 2 to generate a 10-year projected survey-mode exposure map. This calculation takes into account the loss of observing time due to SAA passages and the instrumental deadtime. However it does not include the effect of the modified observation strategy conducted during Dec 2013-Dec 2014. Only diffuse backgrounds are considered in the calculation (the effect of the point sources is ignored). The calculation uses gll_iem_v06.fits and iso_P8R2_SOURCE_V6_v06.txt for the galactic IEM and isotropic templates respectively. The semi-analytical prescription is described in the appendix of the 2FGL paper.
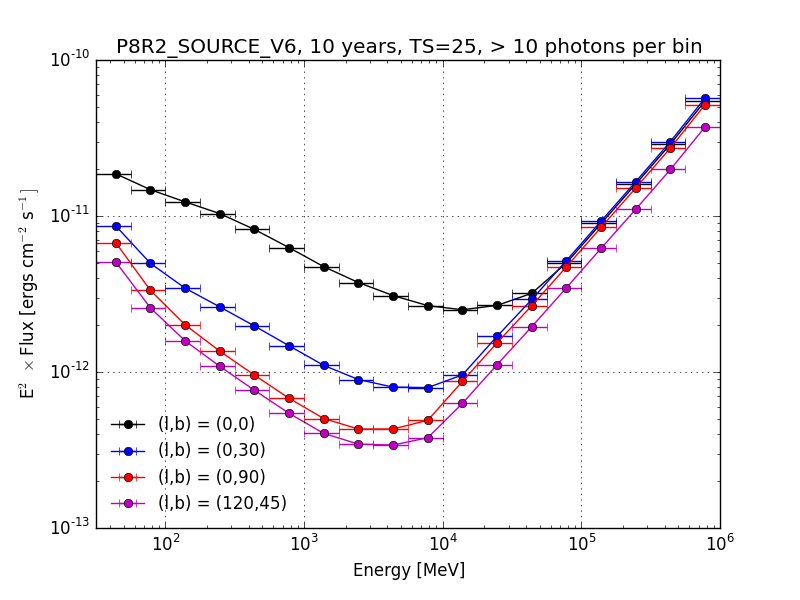
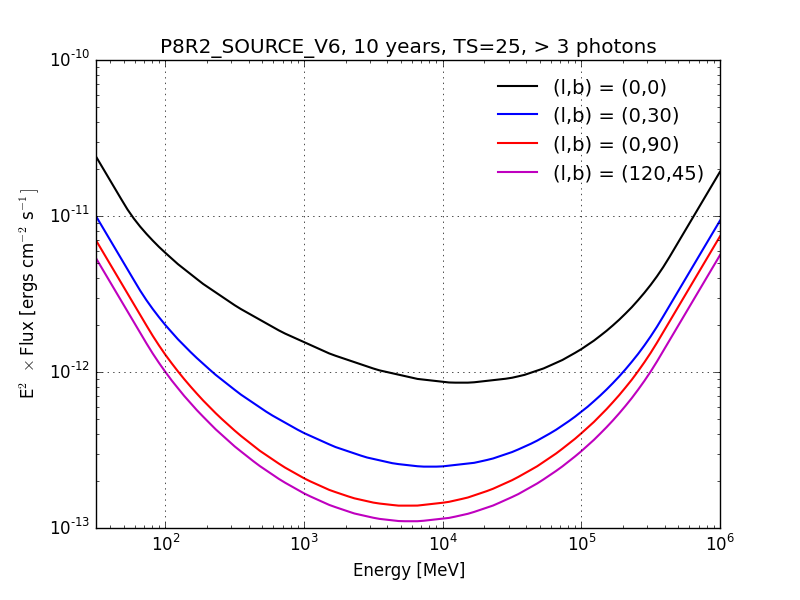
The plot below is a P8R2_SOURCE_V6 differential sensitivity plot for ten years in 4 bins per energy decade between 31.6 MeV and 1 TeV. It assumes a point source with a power-law spectrum with index 2 and uniform background around it. The curves are for four different locations (shown in Galactic coordinates): Galactic center, intermediate latitudes, north Galactic pole, and north Celestial pole. No unresolved source contribution (sometimes referred to as source confusion) and no uncertainties on diffuse backgrounds are included in the semi-analytical calculation. Only diffuse backgrounds are considered (i.e. the effect of the point sources is ignored). A minimum of 10 photons per energy bin is required.
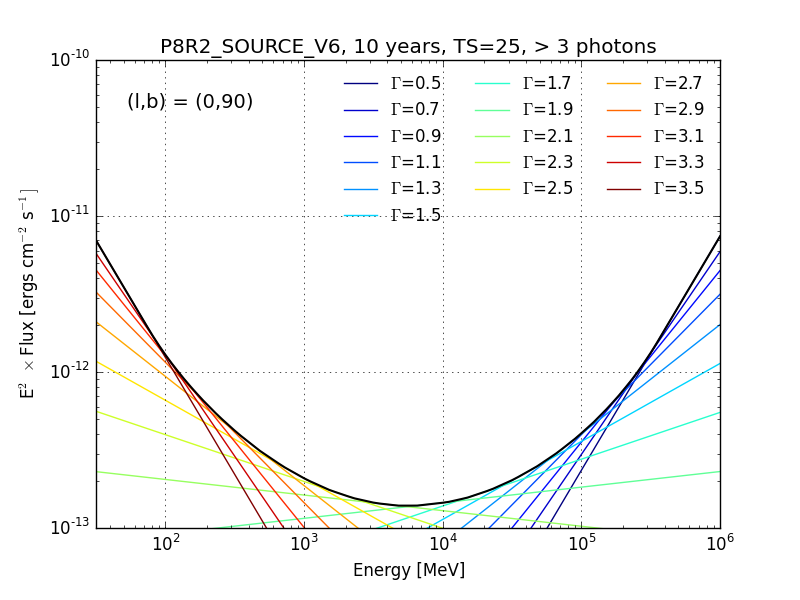
The plots below show the P8R2_SOURCE_V6 broadband sensitivity to power-law sources. Here we define the broadband sensitivity at energy E as the maximum flux of a power-law source at the LAT detection threshold for any spectral index. In practice this is calculated from the envelope of power-law spectral models at the LAT detection threshold (left plot). Whereas the differential sensitivity is computed within an energy bin, the broadband sensitivity reflects the detection threshold when performing analysis over the full LAT energy range.
Broadband and differential flux sensitivities evaluated at different locations in Galactic coordinates are given in machine-readable tables below:
- Differential Flux Sensitivity (l=0, b=0)
- Differential Flux Sensitivity (l=0, b=30)
- Differential Flux Sensitivity (l=0, b=90)
- Differential Flux Sensitivity (l=120, b=45)
- Broadband Flux Sensitivity (l=0, b=0)
- Broadband Flux Sensitivity (l=0, b=30)
- Broadband Flux Sensitivity (l=0, b=90)
- Broadband Flux Sensitivity (l=120, b=45)
Low-Energy Performance Plots
Relative to the Pass 7 Reprocessed data release, Pass 8 has dramatically enhanced the LAT performance at energies below 100 MeV. The plots in this section are chosen to highlight the LAT performance in this energy range. Validation of the low-energy performance of the LAT is on-going and recommendations and usage notes for analysis of LAT data at low energies are available on the LAT Caveats Page. The systematic uncertainties of the LAT response functions are substantially larger below 30 MeV and the LAT team does not currently recommend using data at these energies.
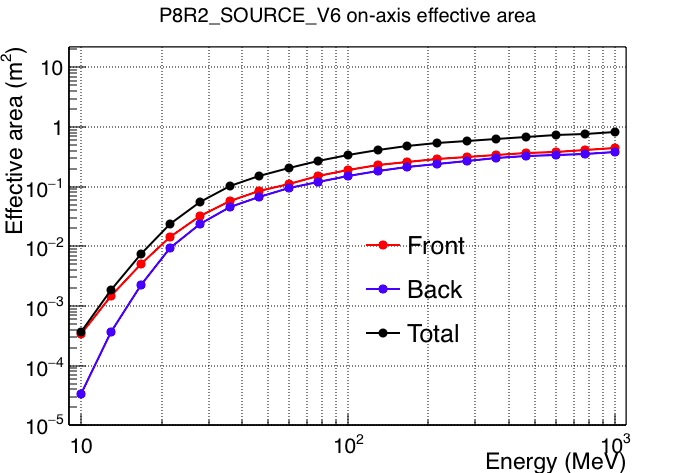
Effective Area
The plots below are:
- the effective area as a function of energy for normal incidence photons (θ=0) shown down to 10 MeV. The y-axis (effective area) is shown in log scale;
- the effective area as a function of incidence angle theta for 10 GeV photons;
- the effective area as a function of the azimuthal angle phi for 10 GeV photons, 30 degrees off-axis;
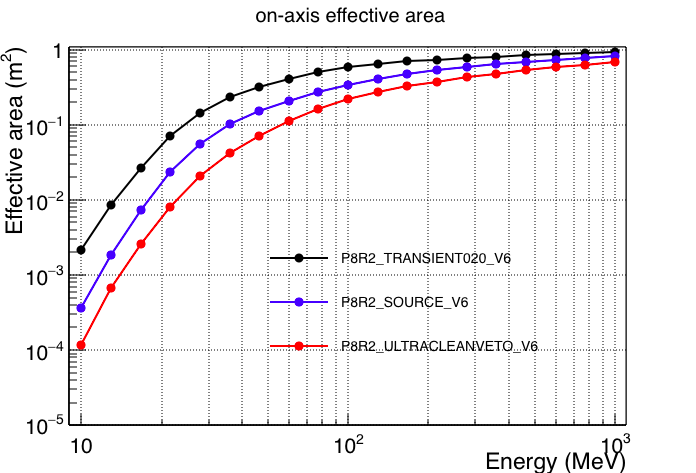
- comparison of the on-axis effective area (as a function of the energy) for different P8R2_V6 event classes (Total).
Acceptance
The plots below are:
- the acceptance as a function of energy shown down to 10 MeV;
- the acceptance as a function of the EDISP and PSF event types;
- comparison of the acceptance (as a function of the energy) for different P8R2_V6 event classes (Total).
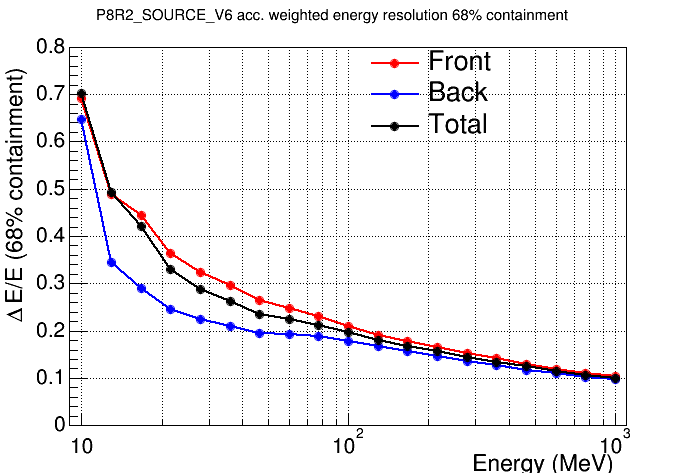
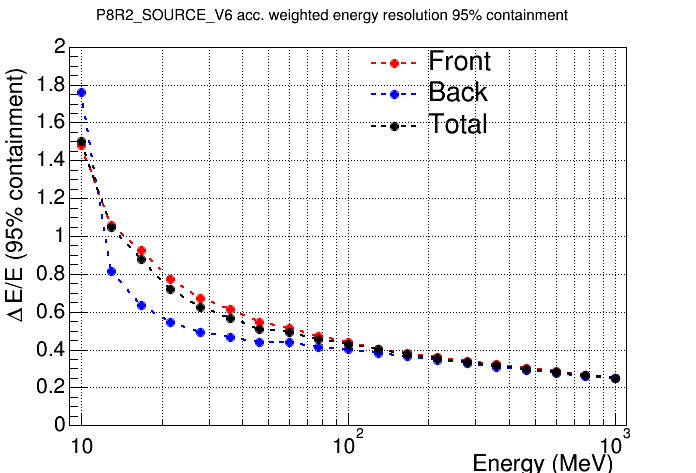
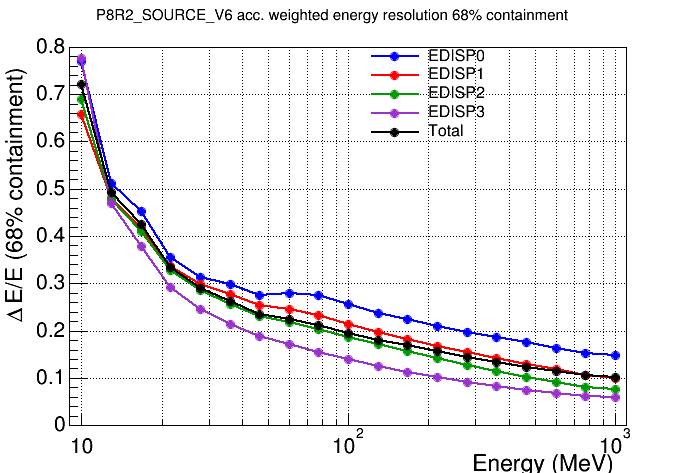
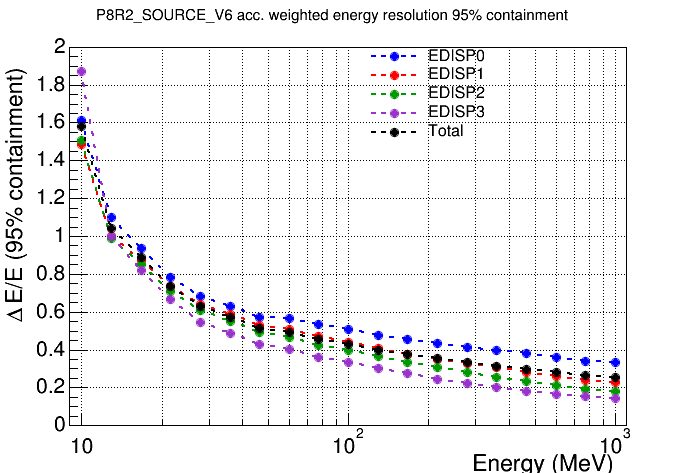
Energy Resolution
The plots below are:
- Acceptance weighted (acc. weighted) energy resolution (i.e. 68% and 95% containment half width of the reconstructed incoming photon energy) as a function of energy down to 10 MeV for the front/back and EDISP event types.
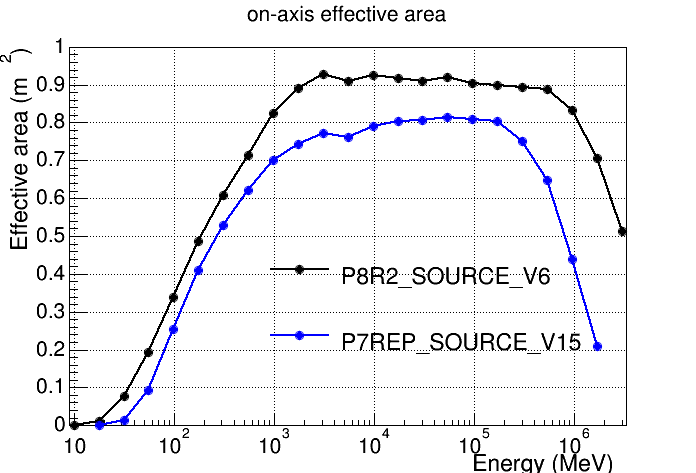
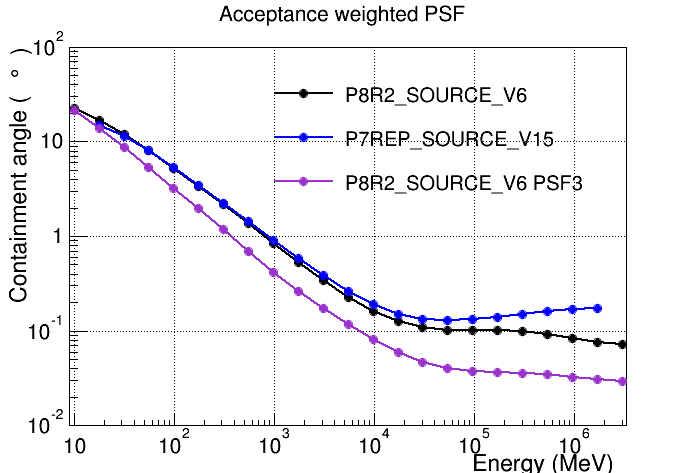
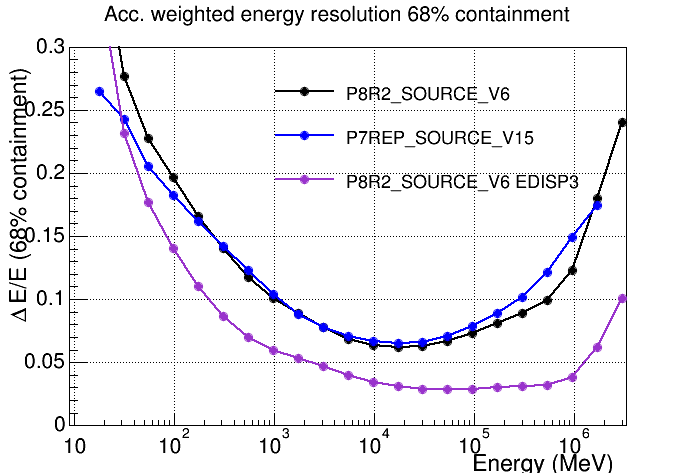
Pass 7 Reprocessed and Pass 8 comparison
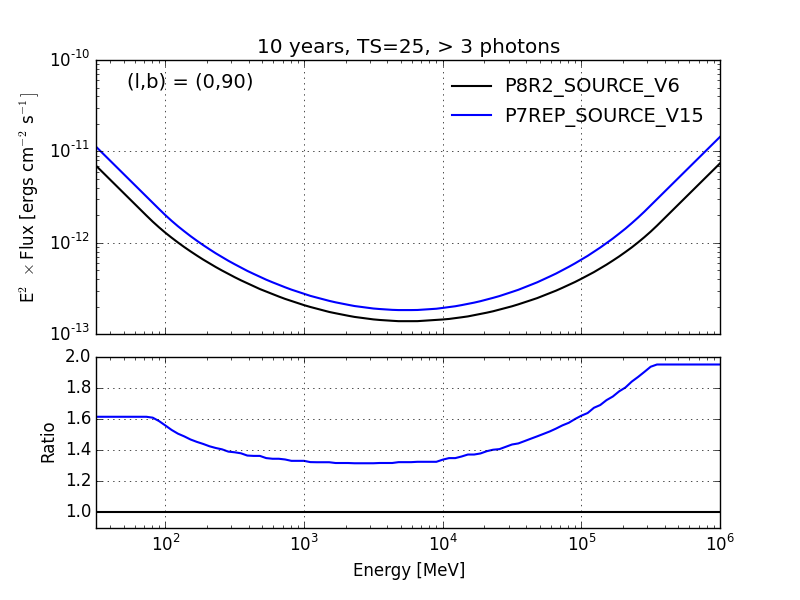
The plots in this section show the performance comparison of the P7REP_SOURCE_V15 and P8R2_SOURCE_V6 event classes. Note that with respect to the P8R2 IRFs, the P7REP IRFs are defined in a narrower energy range between 17 MeV and 1.7 TeV.
The plots below are:
- Acceptance
- Effective area
- Acceptance-weighted PSF (68% containment)
- Acceptance-weighted energy dispersion (68% containment half width)
- LAT Home Page
- LAT Design, Development, and Operations Page
- Fermi Mission
- Fermi Science Support Center
- Fermi Users Group
- GBM Home Page
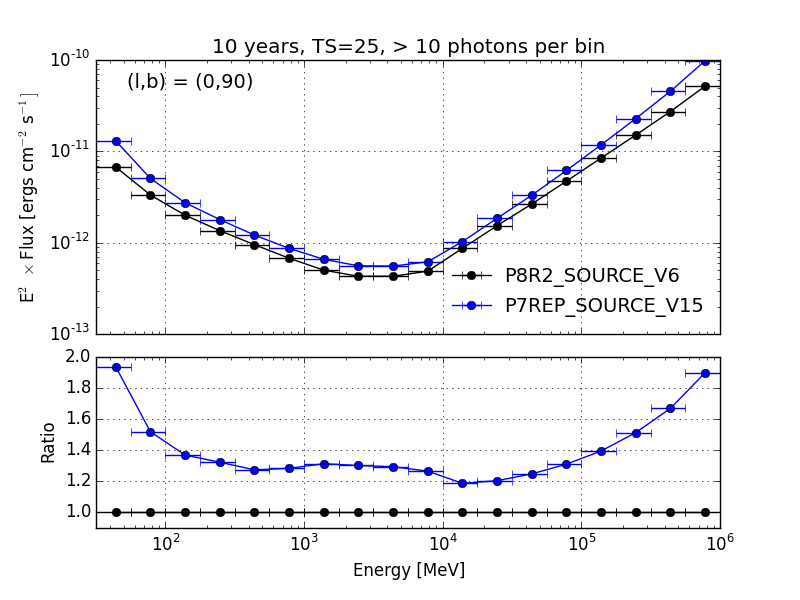
The following two plots contain the comparison of the differential sensitivity (left) and broadband sensitivity (right) at the north Galactic pole for a ten-year observation in survey mode. The calculation is performed with the same methodology as described in the Sensitivity Plots section.
If there is any additional information you would find useful to have posted on this page, please contact the Fermi Project Scientist Julie McEnery and/or the LAT Analysis Coordinator, Luca Baldini.
Fermi LAT performance updates and archive
Earlier performance descriptions are archived; see:
Science performance requirements for the LAT are given in Table 1 of the Science Requirements Document.
The Fermi data and the full set of response functions and Science Analysis Tools can be downloaded from the Fermi Science Support Center website's Data Section.
Useful links:
Updated on June 15, 2016, maintained by Matthew Wood (mdwood@slac.stanford.edu), Regina Caputo (rcaputo@ucsc.edu), Riccardo Rando (riccardo.rando@pd.infn.it), Eric Charles (echarles@slac.stanford.edu), Seth Digel (digel@slac.stanford.edu) and Luca Baldini (luca.baldini@pi.infn.it).