
Fermi LAT Performance |
This page summarizes the top-level performance descriptions of the Fermi-LAT observatory that are currently used by the collaboration for science analysis and are available to the general public.
The LAT performance is governed primarily by three things:
- LAT hardware design
- Event reconstruction algorithms
- Background selections and event quality selections
A result of the analysis is the production of full Instrument Response Functions (IRFs), describing the performance as a function of photon energy, incidence angle, conversion point within the instrument, and other important parameters.
P7_V6 Instrument Response Functions
The plots below represent the work of many people in the LAT team. They correspond to the status of the analysis known as P7SOURCE_V6, which has been optimized for the study of point-like sources and the production of the second LAT source catalog (2FGL).
These IRFs are based on updated event analysis and selection criteria that take into account effects measured in flight that were not considered in pre-launch performance estimates (Pass6_V1). The effects were primarily pile-up and accidental coincidence effects in the detector subsystems leaving ghost signals in the detector in coincidence with good photon triggers. An updated version of the IRFs (Pass6_V3) distributed with the original public release of Fermi data did take those effect into account, but did not attempt to re-optimize the event selection in light of the knowledge gained in flight.
In order to include the effects of ghost signals in our simulations and appropriate sampling of flight data periodic triggers were overlayed as a background to standard simulations of gamma-rays.
For more details, please refer to the paper Post-launch performance of the Fermi Large Area Telescope.
Important caveats are associated with these IRFs and should be kept in mind when performing analysis of the publicly distributed Fermi-LAT data.
Performance plots
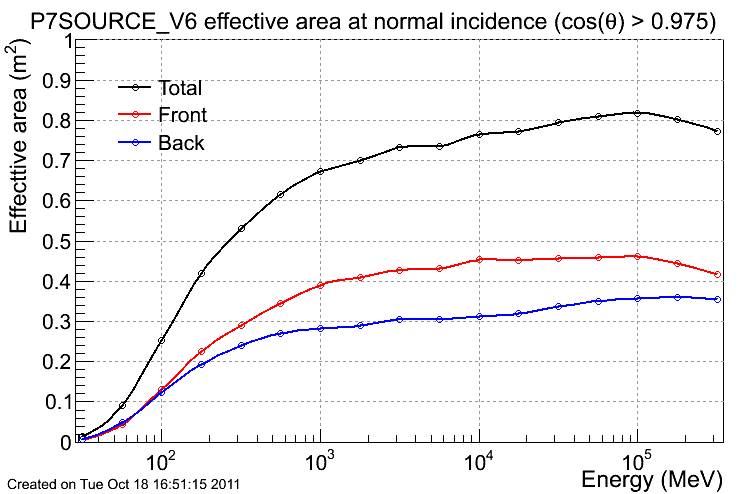
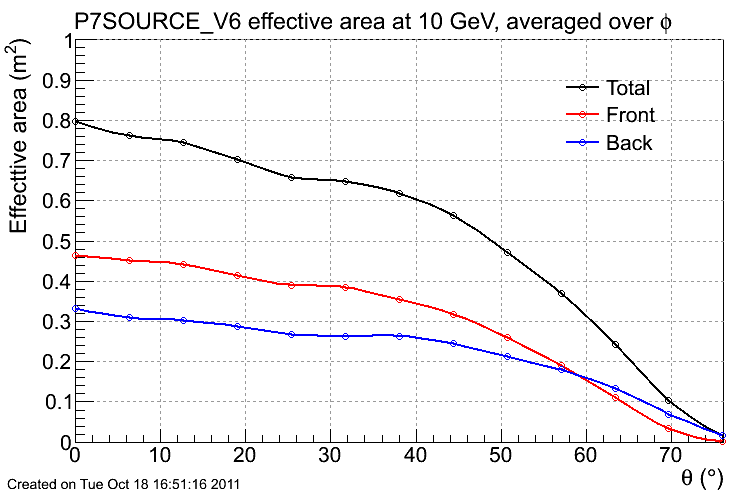
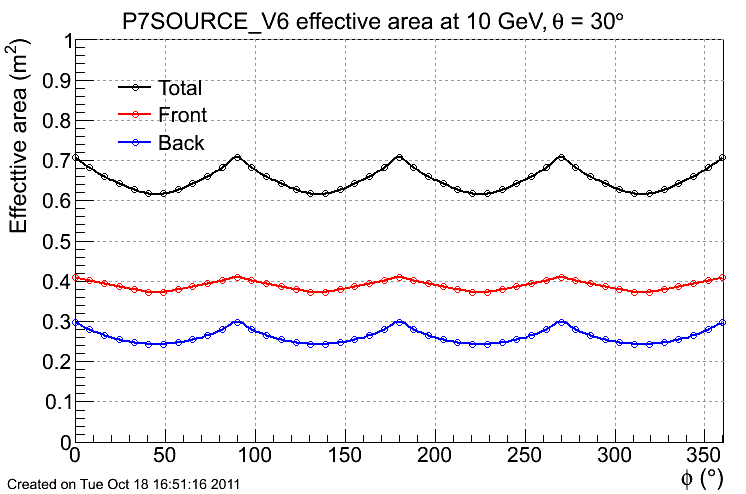
Note: Starting from the front of the instrument, the LAT tracker (TKR) has 12 layers of 3% radiation length tungsten converters (THIN or FRONT section), followed by 4 layers of 18% r.l. tungsten converters (THICK or BACK section). These sections have intrinsically different PSF due to multiple scattering, and the performance plots are presented for both of these sections.
Note: the following plots are produced via the interface to the tabulated IRF values used internally by the LAT science tools. When plotted versus the energy of the incident photons, the response functions are sampled in 5 points per energy decade, which are clearly indicated on the plots and smoothly connected for graphical clarity. Similarly, suitable sets of sampling points are used for plotting specific IRFs vs. theta or phi. As a consequence, we warn against using the values derived from the figures below for any numerical evaluation of the LAT performance.
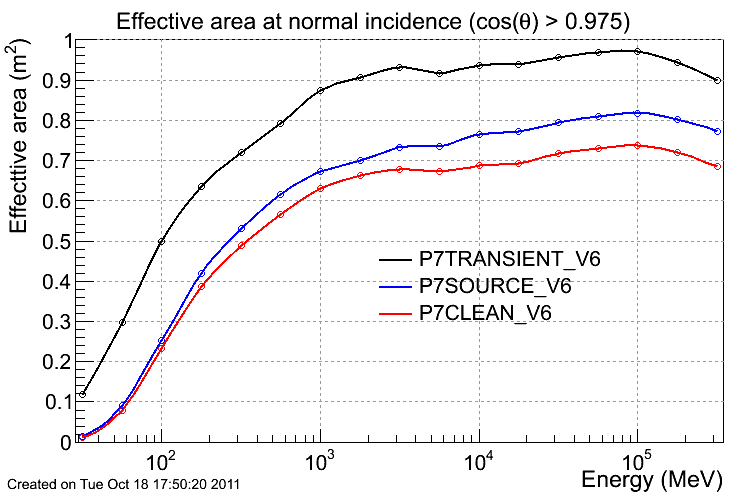
Effective Area
The plots below are:
- the effective area as a function of energy for normal incidence photons (specifically photons impinging on the instrument at cos(theta) > 0.975);
- the effective area as a function of incidence angle theta for 10 GeV photons;
- the effective area as a function of the azimuthal angle phi for 10 GeV photons, 30 degrees off-axis;
- a comparison of the on-axis effective area (as a function of the energy) for different P7_V6 event classes.
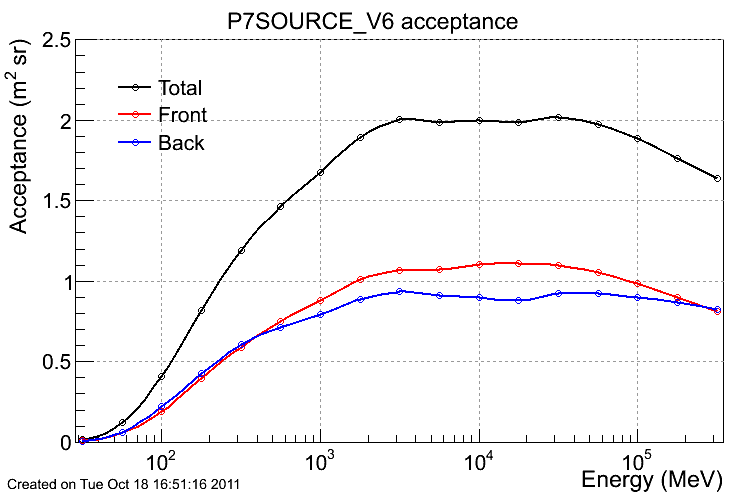
Acceptance
Defined here as the effective area integrated over the solid angle. Notice that the acceptance has a slower turn-on wrt the effective area, highlighting the dependence of the FOV on energy. That is the intrinsic acceptance regardless of the orbital characteristics. To obtain the effective acceptance, the curve has to be scaled by a constant factor which takes into account the instrument deadtime; the South Atlantic Anomaly (SAA), where the LAT does not take data; and details of the observation strategy (about 20% for standard survey and according to current simulations).
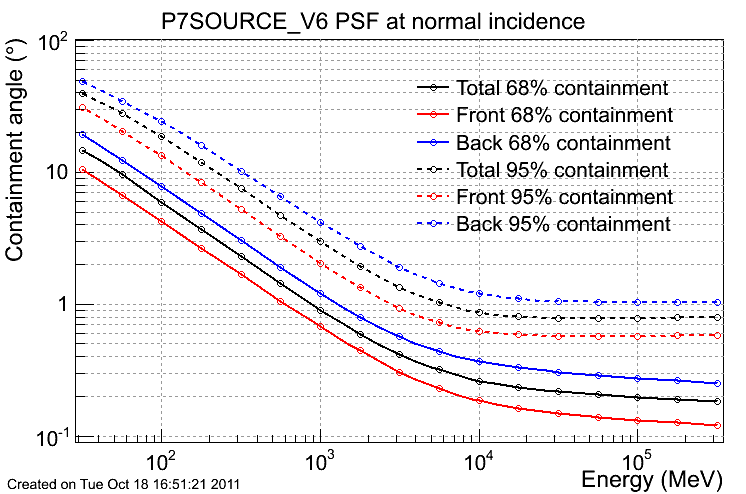
Point Spread Function (PSF)
In the P7_V6 response functions (with the exception of the P7TRANSIENT_V6 event class) the PSF is derived from flight data and, unlike the P6_V3 series, does not include any dependence on the off-axis angle.
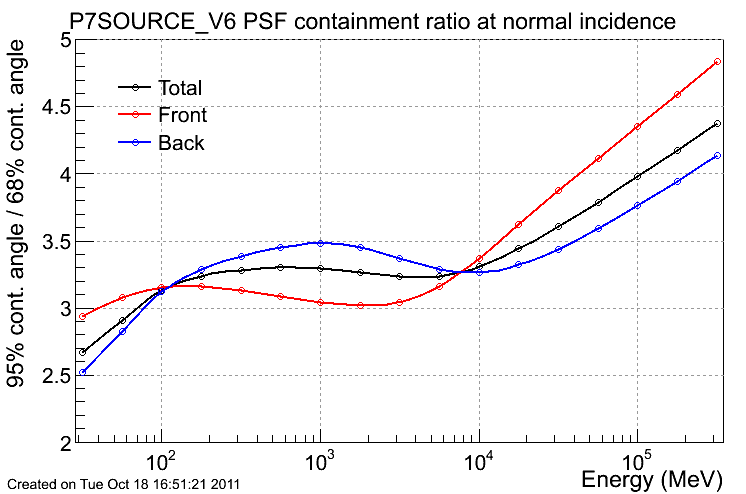
The plots below are:
- 68% and 95% containment angles of the reconstructed incoming photon direction for normal incidence photons;
- the ratio PSF95% / PSF68%, which is a useful indicator of the magnitude of the tails of the distribution.
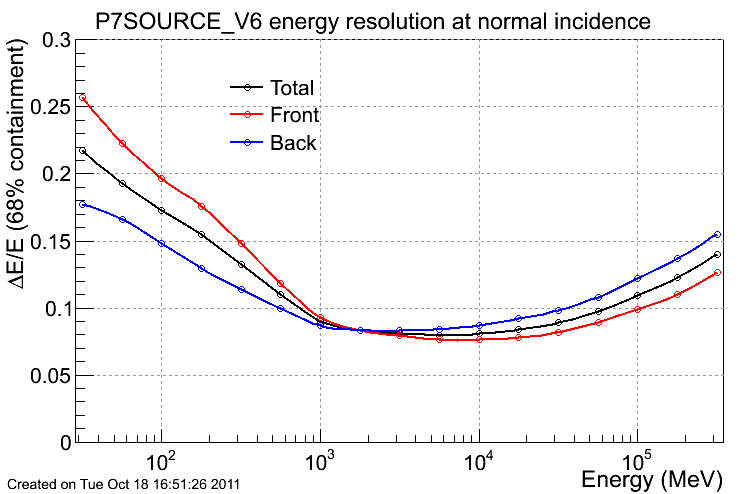
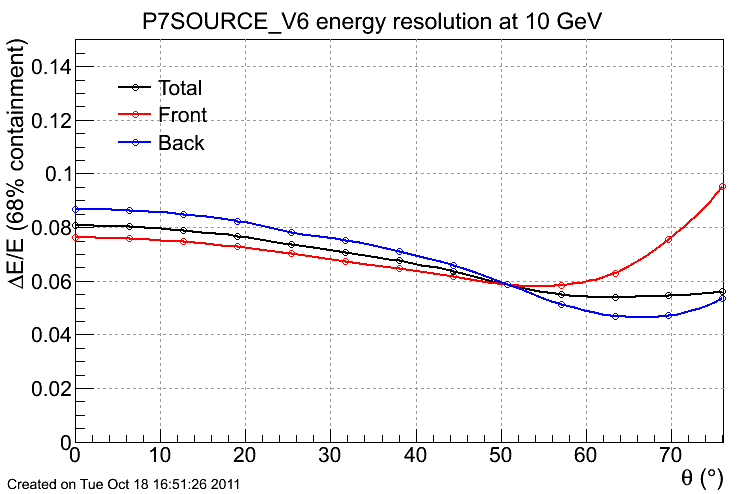
Energy resolution
The plots below are:
- energy resolution (i.e. 68% containment of the reconstructed incoming photon energy) as a function of energy for normal incident photons;
- energy resolution as a function of incidence angle for 10 GeV photons.
Sensitivity Plots
Using the above instrument performance characterization, we have produced additional plots related to point source sensitivity.
Point source sensitivity
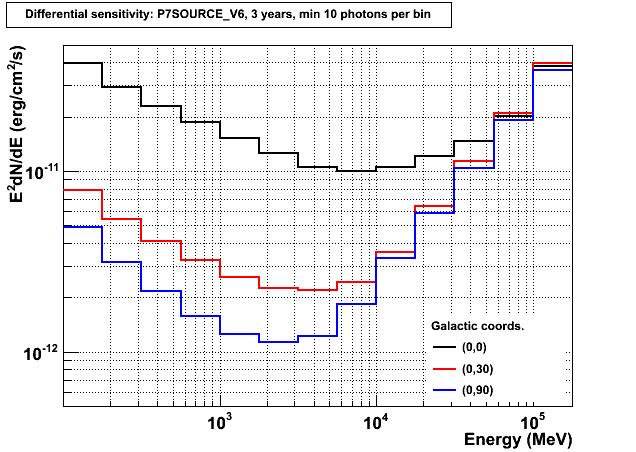
The first plot shows the P7SOURCE_V6 three-year differential sensitivity for an isolated point source. The differential sensitivity is evaluated as the minimum flux above 100 MeV (in ph cm-2 s-1) to obtain the 5-sigma detection in 3 years of observation in survey mode, assuming a power law spectrum with index -2. Quantitatively, the 5-sigma limit is taken as the likelihood test statistic of 25. The sensitivity calculation is based on the two-year exposure maps scaled to three years (i.e. it takes into account the loss of observing time due to SAA passages and the instrumental deadtime). Only diffuse backgrounds are considered in the calculation (i.e. the effect of the point sources is ignored). The semi-analytical prescription is described in the appendix of the 2FGL paper.
The plot below is a P7SOURCE_V6 differential sensitivity plot for three years in 4 bins per energy decade. It assumes a point source with a power-law spectrum with index -2 and uniform background around it. The curves are for 3 different locations (shown in galactic coordinates): galactic center, intermediate latitudes, north galactic pole. No source density (sometimes aka "source confusion") and no uncertainties on diffuse backgrounds are included in the semi-analytical calculation. Only diffuse backgrounds are considered (i.e. the effect of the point sources is ignored). A minimum of 10 photons per energy band is required.
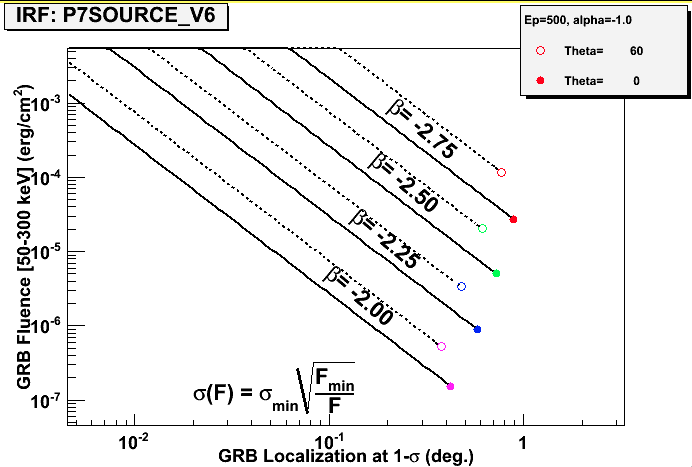
Gamma ray burst sensitivity
An estimator for the Localization power as a function of the fluence is plotted in the graph below. Each marker corresponds to a different inclination angle and a different high energy spectral index, and represents the minimum fluence (in the standard 50 keV-300 keV energy band), which corresponds to a detection (y-axis) vs the 68% localization accuracy (x-axis). The solid and dotted lines are the result of the formula shown on the canvas, and allow computation of the localization at a given fluence (for normal incidence and for 60 degrees off-axis).
If there is any additional information you would find useful to have posted on this page, please contact Julie McEnery and/or the LAT Analysis Coordinator, Gino Tosti.
Fermi LAT performance updates and archive
Earlier performance descriptions are archived; see:
Science performance requirements for the LAT are given in Table 1 of the Science Requirements Document.
The Fermi data and the full set of response functions and Science Analysis Tools can be downloaded from the Fermi Science Support Center website's Data Section.
Useful links:
- LAT Home Page
- LAT Design, Development, and Operations Page
- Fermi Mission
- Fermi Science Support Center
- Fermi Users Group
- GBM Home Page
Updated on October 27, 2011, maintained by Riccardo Rando (riccardo.rando@pd.infn.it), Eric Charles (echarles@slac.stanford.edu), Seth Digel (digel@slac.stanford.edu) and Luca Baldini (luca.baldini@pi.infn.it).