| Key information : (1) The Antimony-Beryllium source has a spread in neutron energy from 22.8 keV to 24.1 keV. The Yttrium-Beryllium source has a spead in neutron energy from 151 keV to 159 keV. The neutrons are quasi-monoenergetic as we only consider those emitted in the forward direction and hitting our detectors(subtending a small solid angle).
(2) < Repeated abbreviations in descriptions, if any, go here >. |
|||||
| Figure Number | Result | Topic | Last Updated | Download | Comments |
|---|---|---|---|---|---|
| 1. | 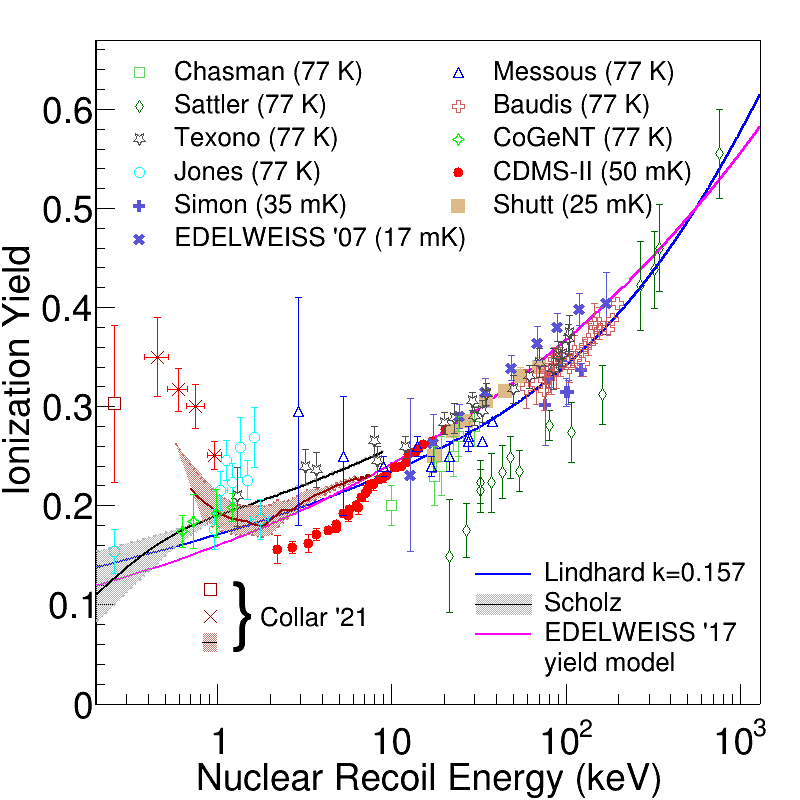 |
Ionization yield measurements in Germanium by various experiments |
February 14, 2022 | png, pdf, eps | arXiv:2202.07043, Figure 1.
Literature data on ionization yield measurements as a function of recoil energy in germanium [6] [7] [8] [20] [9] [10] [11] [12] [21] [13] [14] [22] [15] [23] [32]. Measurements by Shutt, Simon, EDELWEISS, CDMS-II and Scholz are in the mK temperature range, while all others are at 77~K. The CDMS II yield measurements are from a single detector [10] that is similar to the averaged yield over all detectors. However, variation across individual detectors was more than the statistical uncertainty of the measurement shown here [30]. EDELWEISS has reported two measurements, (i) discrete yield measurements using a 252Cf neutron source [21], and (ii) continuous measurement using an 241Am9$Be neutron source fitted by a power law function considered as their yield model [23]. The work by Collar et al. reports three different approaches to measuring ionization yield in germanium, (i) using photo-neutrons from an 88Y9Be source indicated by the red band, (ii) using nuclear recoils from thermal neutron capture indicated by the red hollow square marker, and (iii) using an iron-filtered low energy neutron beam [31]. The prediction by Lindhard et. al. [16] [17] [18] [19] is also shown for comparison. |
| 2. | 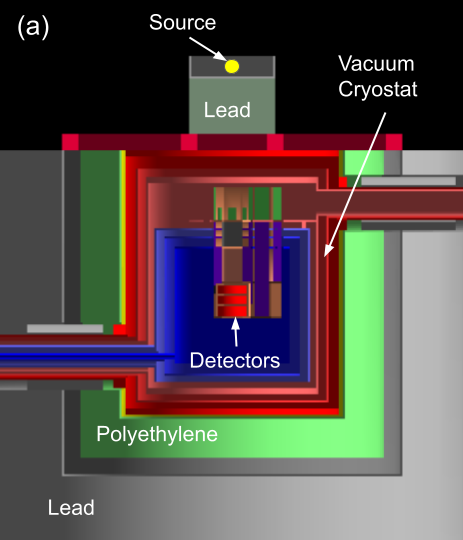
|
The SuperCDMS Soudan setup for the photo-neutron run |
February 14, 2022 | png | arXiv:2202.07043, Figure 2 (a).
The experimental setup with the shielding configuration. Lead was used to shield against gammas. Polyethylene shielding was required for the dark matter configuration and only the top portion was removed from the experiment in order to perform the photo-neutron calibration. |
| 3. |  |
Five tower design of SuperCDMS Soudan |
February 14, 2022 | png | arXiv:2202.07043, Figure 2 (b).
Detectors were arranged into 5 towers with 3 detectors in each tower. Each face of the detectors had four phonon channels. The phonon channel layout is indicated by the different colours on the upper face of the detector. The photo-neutron source was placed above and between towers T2 and T5. The T2Z1 and T5Z2 detectors used in this analysis have been highlighted in pink. The detectors T2Z2 and T5Z1, highlighted in blue, were used for a systematic study of the event rate due to the position of the source over the two towers. |
| 4. | 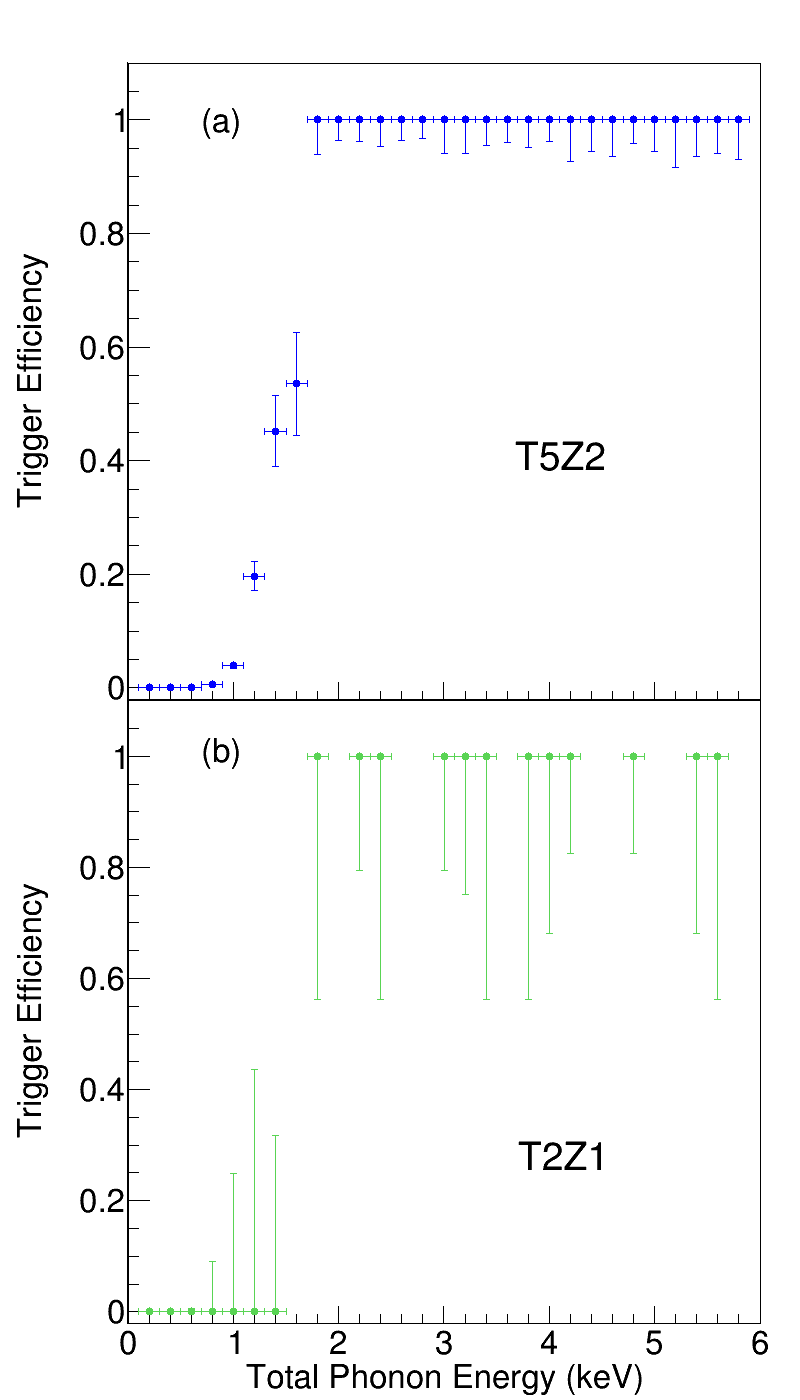 |
Trigger Efficiency of the two detectors |
February 14, 2022 | png, pdf, eps | Trigger efficiency as a function of energy is shown for T5Z2 detector in panel (a) and T2Z1 in panel (b). |
| 5. |  |
Cut efficiency of all analysis cuts combined for each dataset |
February 14, 2022 | png, pdf, eps | arXiv:2202.07043, Figure 3.
Combined and smoothed cut efficiency as a function of energy above the analysis threshold for each data set with a 1-sigma uncertainty. (a) With the Be wafer i.e. neutron-ON, and (b) without the Be wafer i.e. neutron-OFF. |
| 6. |  |
Simulated nuclear recoil energy spectrum from photo-neutrons sources. |
February 14, 2022 | png, pdf, eps | arXiv:2202.07043, Figure 4.
The simulated recoil energy distributions from (a) 124Sb$9Be, and (b) 88Y9Be in T5Z2. The energy depositions from electron recoils (ER) that arise from secondary gammas is shown in blue, the energy depositions from multiple-scatter nuclear recoils (NR) by neutrons in the detector is shown in green. The energy distribution of single-scatter NR by neutrons is shown in red. |
| 7. | 
|
Uncertainty in the neutron-nucleus cross section in germanium | February 14, 2022 | png, pdf, eps | arXiv:2202.07043, Figure 5.
Three examples of realizations of neutron-nucleus scattering cross-section over a large neutron energy range from the TENDL-2017 nuclear data library [29]. Inset is zoomed into the neutron energy range of interest where the differences between the cross sections are considerable between the three realizations. See text body for description of how TENDL cross-section realizations are generated. |
| 8. | 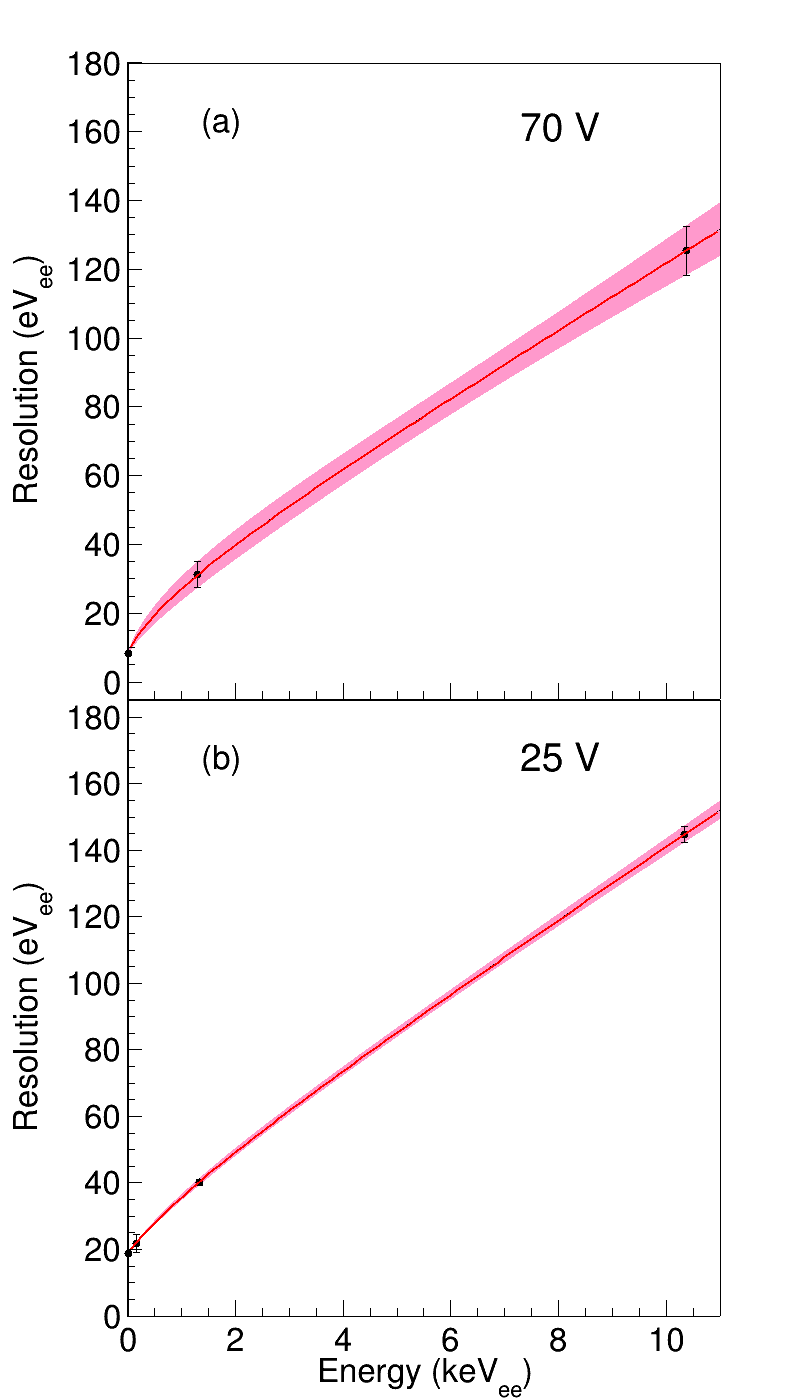 |
Phonon resolution |
February 14, 2022 | png, pdf, eps | The phonon resolution with 1σ uncertainty obtained from the electron capture (EC) lines in 71Ge for the data used in the resolution model described in the paper in panel (a) and for the 25 V data in panel (b). The 70 V data used K shell and L shell EC lines while 25 V data used K shell, L shell, and M shell lines. |
| 9. | 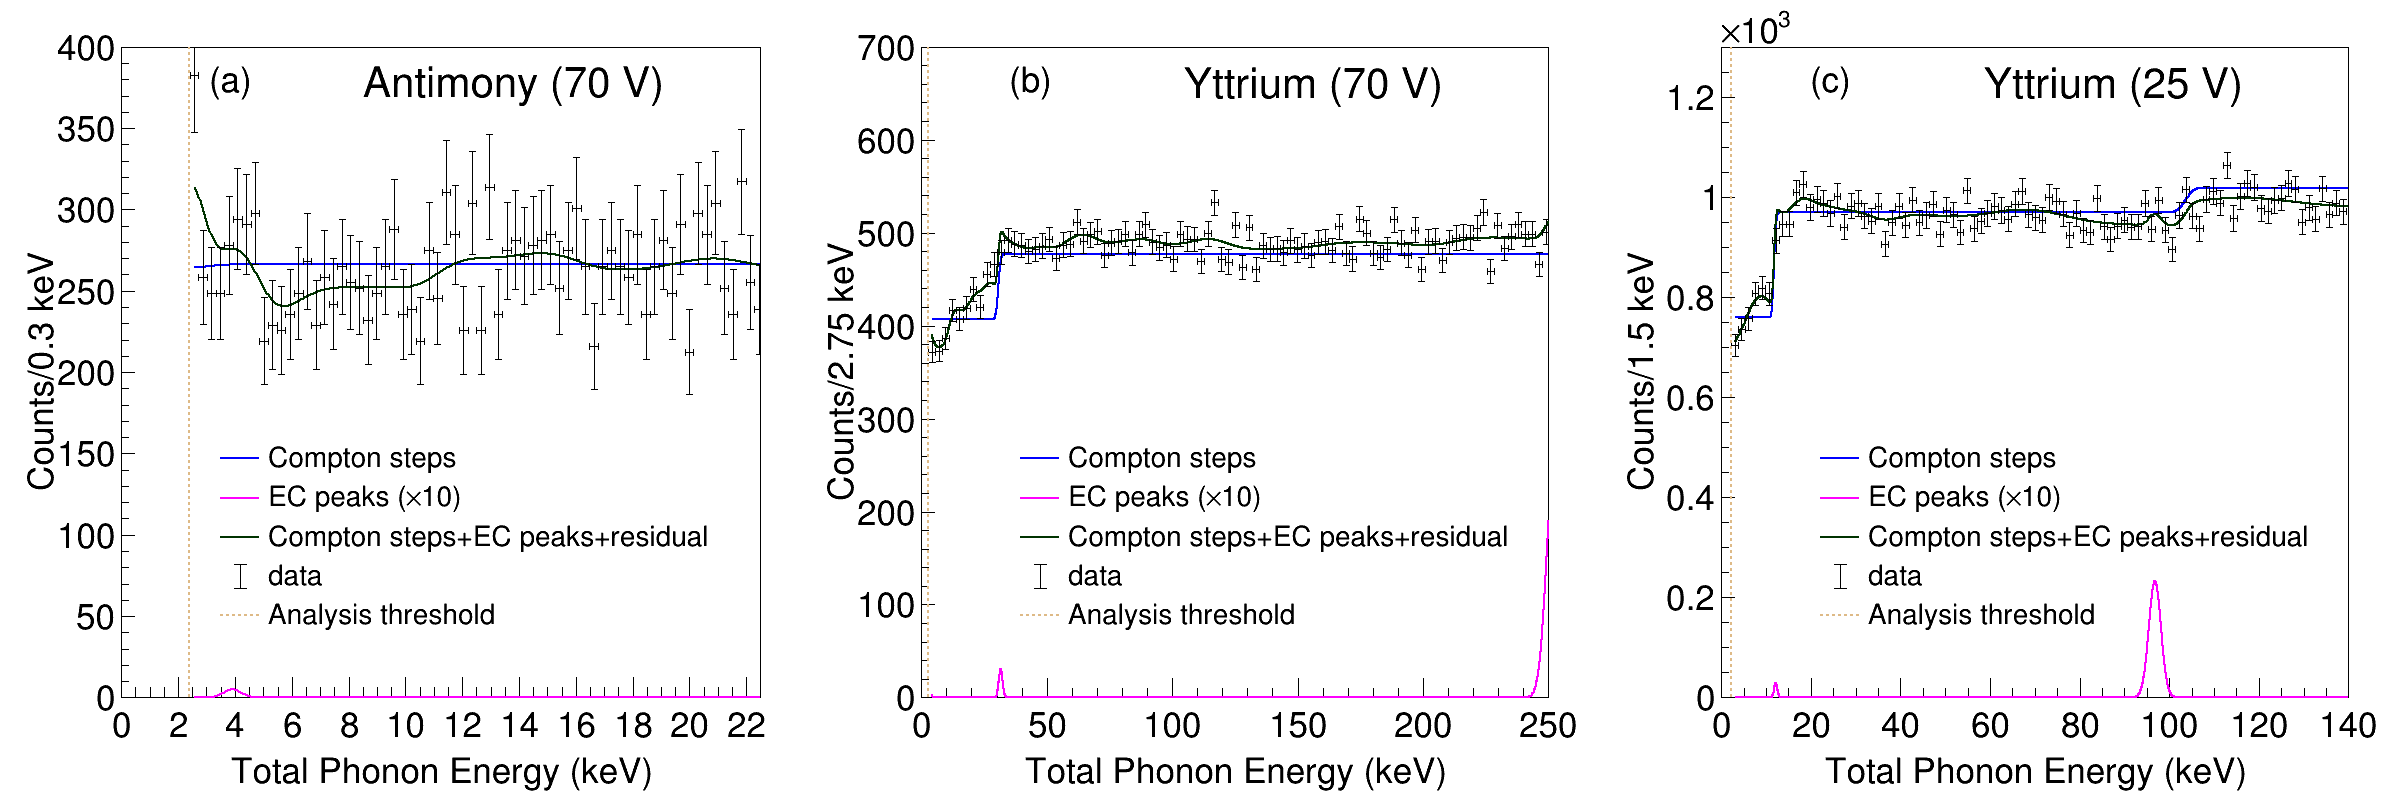 |
Background model |
February 14, 2022 | png, pdf, eps | arXiv:2202.07043, Figure 6.
Neutron-OFF energy spectrum for the three data sets, (a) 124Sb9Be with T5Z2 biased at 70\,V, (b) 88Y9Be with T5Z2 biased at 70\,V and (c) 88Y9Be with T2Z1 biased at 25\,V. The contribution from each component in the background model is shown. The contribution of the electron capture peaks have been scaled up by a factor of ten for better visualization. |
| 10. | 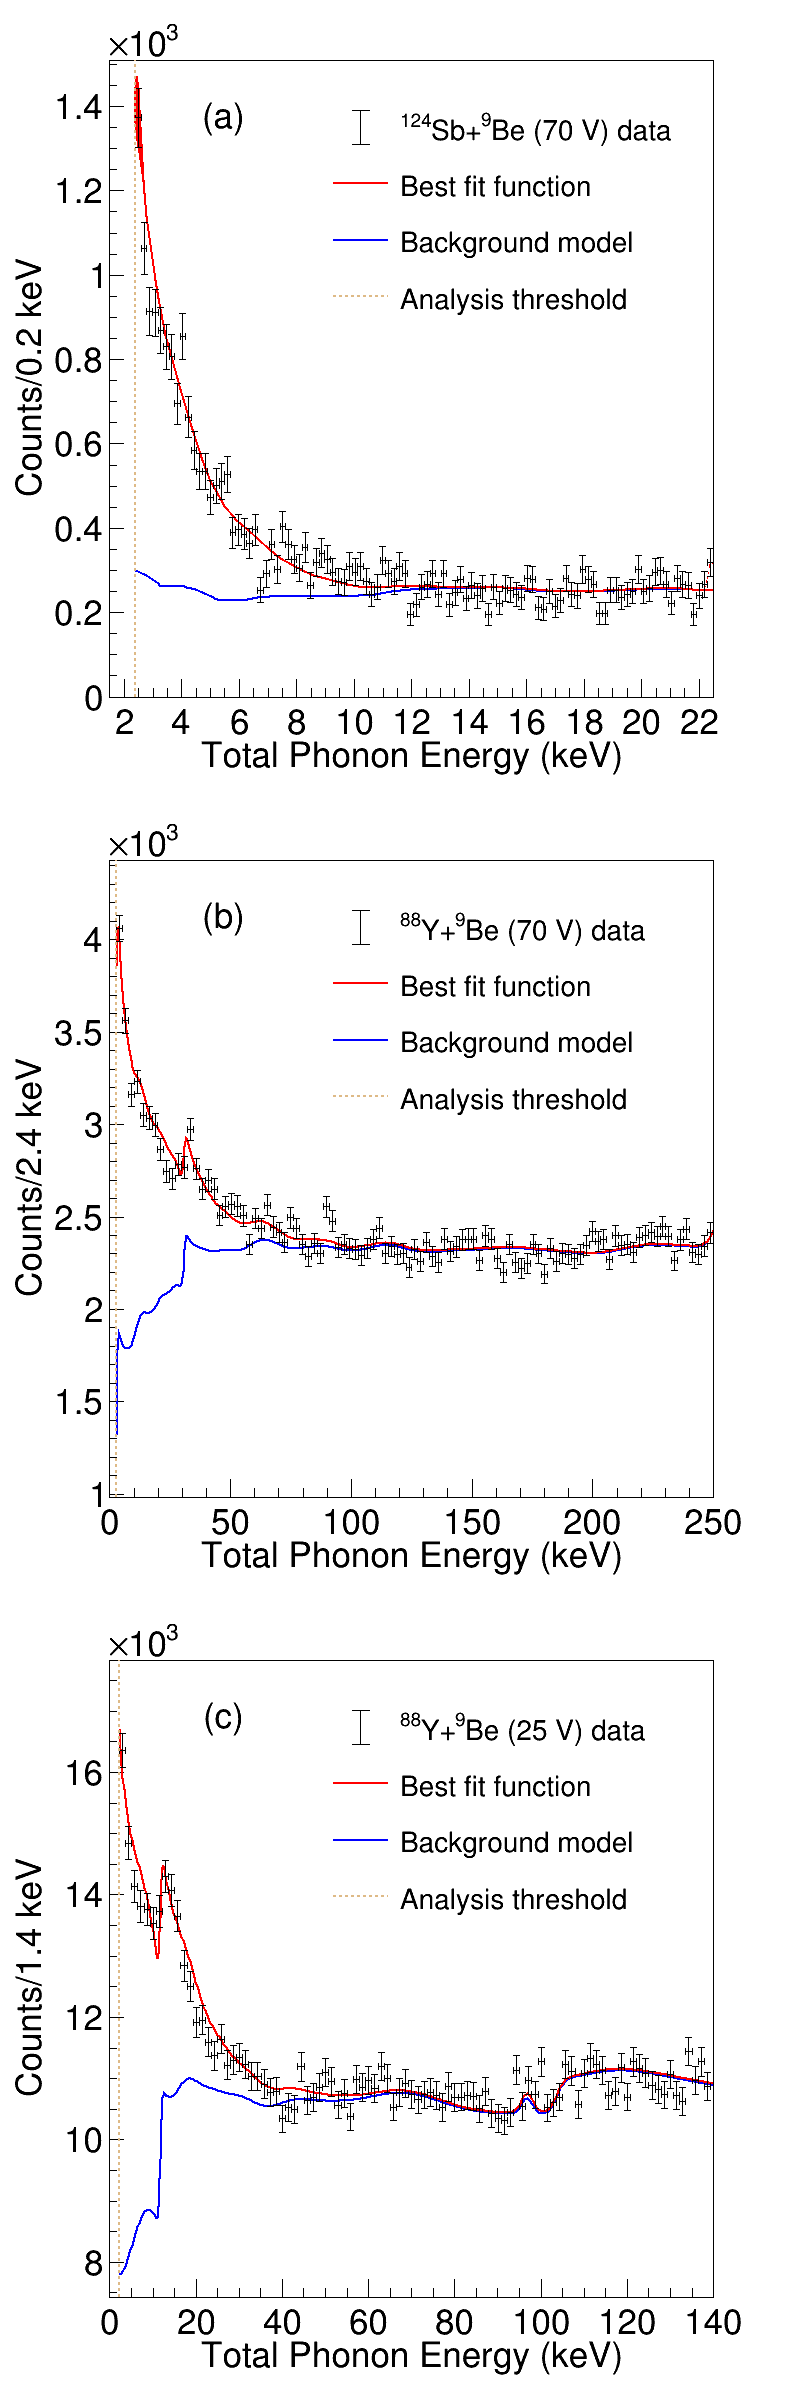 |
Best fit function on data |
February 14, 2022 | png, pdf, eps | arXiv:2202.07043, Figure 7.
Energy spectrum for the three data sets, (a) 124Sb9Be with T5Z2 biased at 70\,V, (b) 88Y9Be with T5Z2 biased at 70\,V and (c) 88Y9Be with T2Z1 biased at 25\,V. The best fit result for each dataset is overlaid in red. The blue curve shows the fit gamma background contribution. |
| 11. | 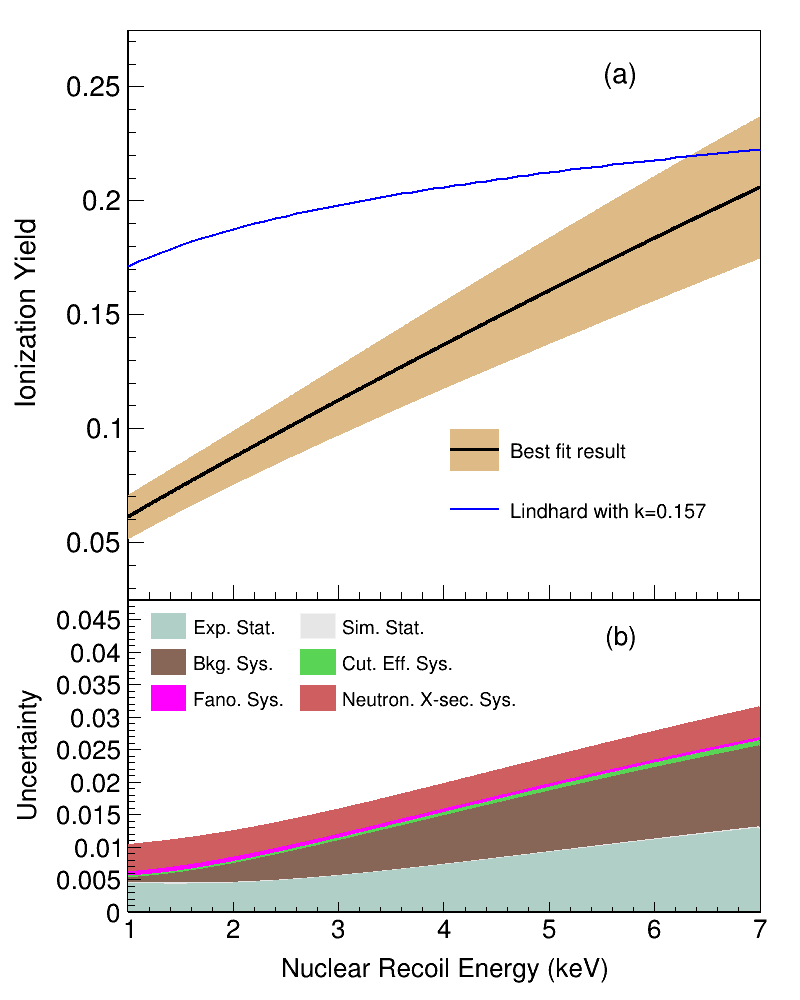 |
Yield Extraction Result |
February 14, 2022 | png, pdf, eps | arXiv:2202.07043, Figure 8.
(a) The ionization yield with 1-sigma uncertainty from the best fit values of the 2-component k-parameter Lindhard model as a function of the nuclear recoil energy in germanium. The blue line shows the standard Lindhard model with k=0.157. (b) The contribution of various sources of statistical and systematic uncertainties to the ionization yield in germanium. The lower limit of the x-axis represents the analysis threshold converted to recoil energy using the best-fit value. |
| 12. | 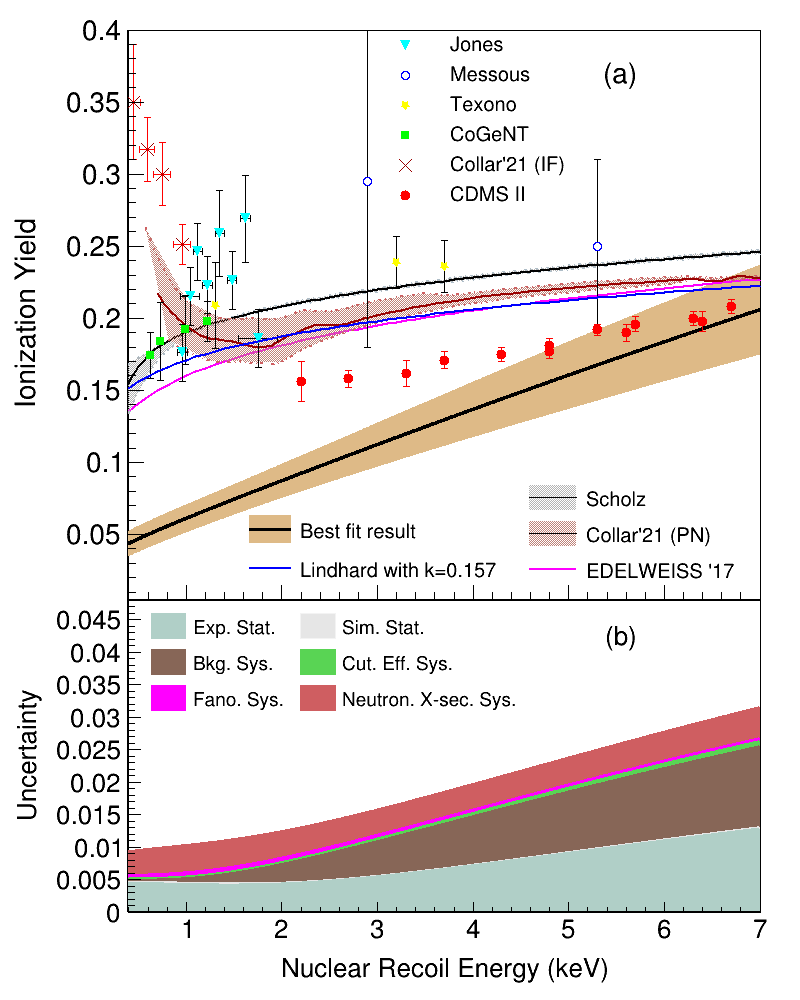 |
Yield Extraction Result with existing results from literature |
February 14, 2022 | png, pdf, eps | (a) The ionization yield with 1-sigma uncertainty from the best fit values of the 2-component k-parameter Lindhard model as a function of the nuclear recoil energy in germanium. The blue line shows the standard Lindhard model with k=0.157. Existing ionization yield measurements [7] [9] [20] [8] [31] [10] [21] [15] in this energy region is also overlaid for comparison. (b) The contribution of various sources of statistical and systematic uncertainties to the ionization yield in germanium. The lower limit of the x-axis represents the analysis threshold converted to recoil energy using the best-fit value. |