| All results assume a relic DM density of $0.3~\mathrm{GeV/cm^3}$, an escape velocity of $544~\mathrm{km/s}$, and Earth's mean orbital velocity of $232~\mathrm{km/s}$. All limits are calculated at the 90% confidence level and explore the typical DM-nucleon cross-section $\sigma_n$. The DM mass is $m_{\chi}$. | ||||
| Result | Topic | Download | Comments | |
|---|---|---|---|---|
 |
Signal Model | png | Figure 1.
The Bremsstrahlung signal drawn for given mass and cross-section for common direct detection target materials. The shape of the model comes from the atomic scattering factors. The dashed lines are elastic scatter NR signals for the same materials. |
|
|
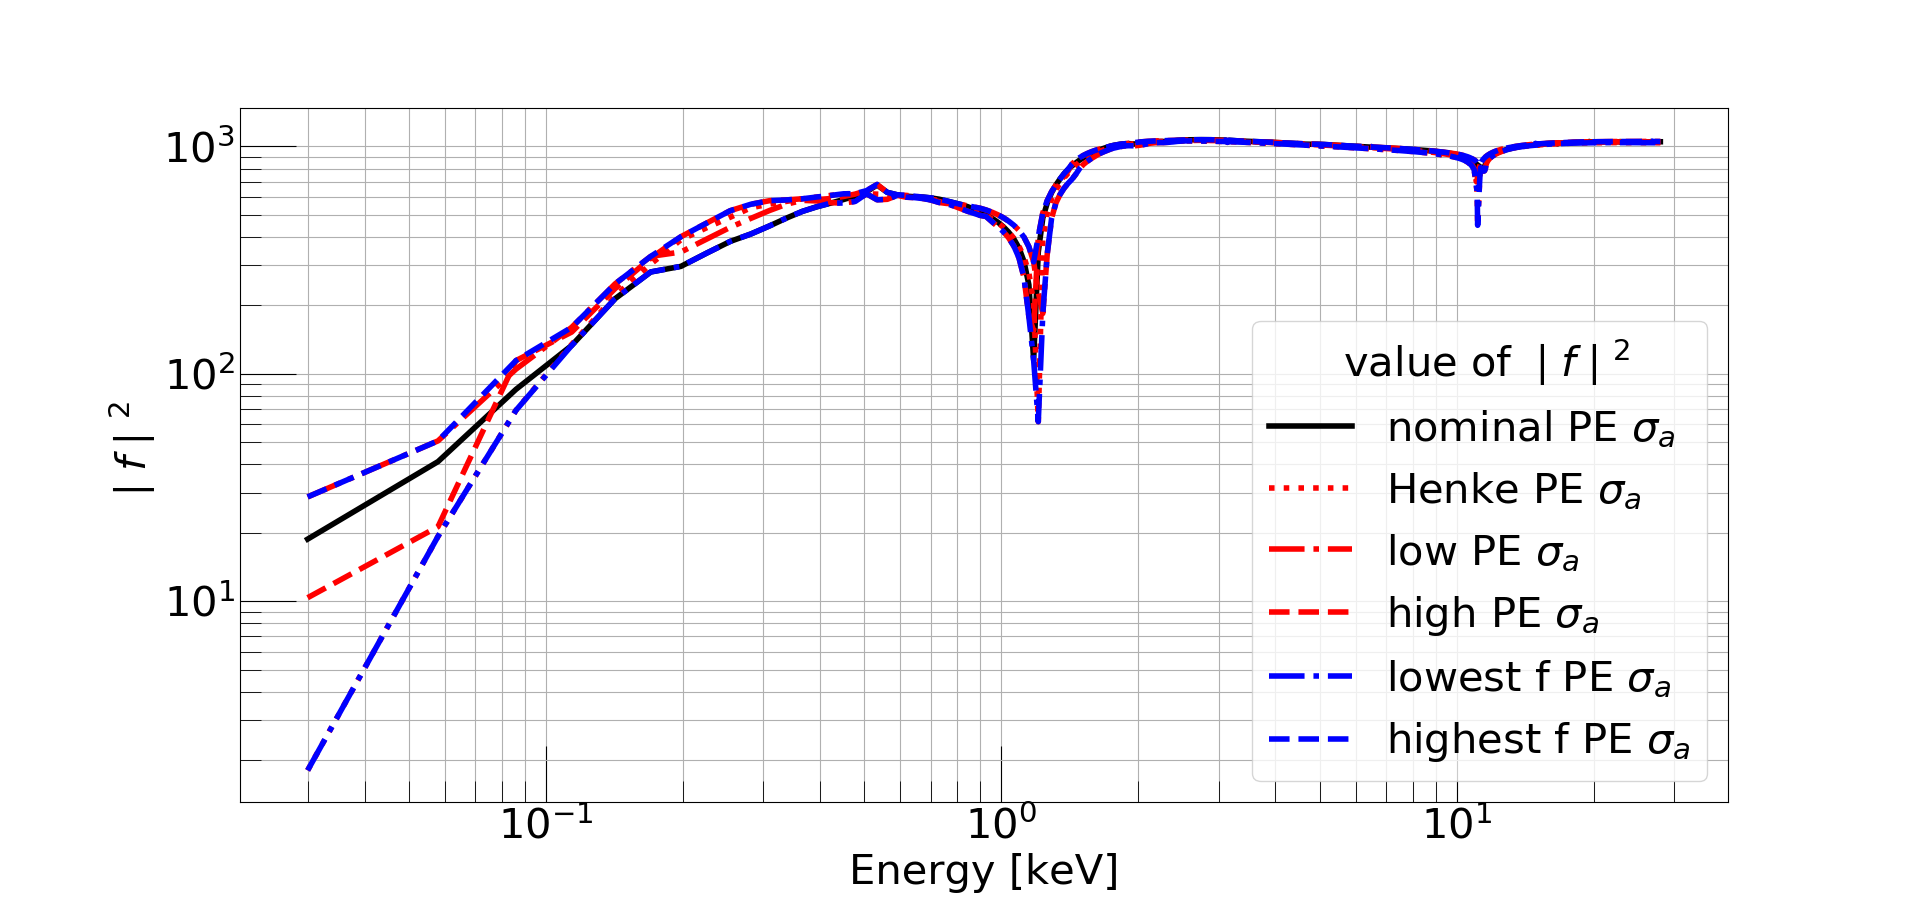
Systematic | png eps Simplified paper versions: png pdf | Figure 2.
The atomic scattering function is calculated from the photoelectric cross-section. There is no discernible trend with energy, so none of the curves can be identified as conservative or aggressive. We explore the standard Henke values and derived a nominal band with high and low uncertainties (low and high PE) based on a literature search. An envelope on the atomic scattering functon (low and high PE) was calculated by taking the minimum (maximum) value of any PE curve to obtain the most conservative (aggressive) parameter. The atomic scattering function is directly proportional to the Bremsstrahlung limit. |
|

|
Efficiency | png, eps | Figure 3.
The efficiency of all cuts in the analysis was calculated below $2~\mathrm{keV}$ and then extended up to $25~\mathrm{keV}$. The fluctuations below $2~\mathrm{keV}$ are from the radial cut, and the red curves show the uncertainty on the efficiency. The efficiency model was incorporated into the likelihood with a single morphing parameter, and the blue curves were drawn by randomly sampling a Gaussian constraint on that parameter. |
|

|
Efficiency | png, eps | Figure 4.
Same as Figure 3, but for R3b. |
|

|
Energy Resolution | png, eps | Figure 5.
The black curve is the best fit of the resolution model to the measured resolution of known features in the data. The red curves represent the uncertainty of the model parameters. The blue curves are created by randomly sampling the multivariate constraint that was used to incorporate the model into the likelihood. |
|

|
Energy Resolution | png, eps | Figure 6.
Same as Figure 5, but for R3b |
|

|
Data Spectrum | png, pdf | Figure 7.
The blue histogram is the R3 dataset that has been fit with all of the signal and background models included in the analysis. While this fit is performed thousands of times, this is one example showing the relative normalizations of the models after being smeared by resolution and scaled by efficiency. The analysis range was extended up to $25~\mathrm{keV}$ to constrain the models that reach higher energies in an effort to break the degeneracy between the flat models at lower energy. |
|

|
Earth Shielding | png, eps | Figure 8.
Plot of the integrated signal model as a function of cross-section. By accounting for shielding from the Earth and atmosphere, DM with stronger cross-sections will be significantly attenuated. This means two different cross-sections can give the same number of signal events, while unattenuated signals would increase linearly with increasing cross-section. |
|

|
Limit Setting | png, eps | Figure 9.
Example of a PLR scan over the number of signal events for a given DM mass and cross-section. The scan is used to calculate the upper limit of signal events that is consistent with the data. In this example, the expected number of signal events (vertical purple line) is smaller than the upper limit (vertical gray line), so the signal model for these DM properties cannot be excluded. |
|

|
Limit Setting | png, eps | Figure 10.
Same as Figure 9, but in this example, the expected number of events (vertical purple line) is larger than the upper limit (vertical gray line), so the signal model corresponding to these parameters is not consistent with the data and is therefore excluded. This process is repeated over all DM parameter space, and the points that are excluded are collected to make up the exclusion bands in Figures 11 and 12. |
|

|
Exclusion Band | png, pdf | Figure 11.
Bremsstrahlung band for all parameter space that was excluded with the limit setting method shown in Figures 9 and 10. Notice there is a ceiling to the sensitivity of the experiment due to shielding of the DM as it scatters through the Earth and atmosphere. |
|

|
Exclusion Band | png, pdf | Figure 12.
Same as Figure 11, but for the Migdal channel. |
|

|
Limit Plot | png, pdf | Figure 13.
Results of Bremsstrahlung and Migdal inelastic dark matter searches among the current state of spin-independent sub-GeV direct detection limits. The Bremsstrahlung result does not exclude any new parameter space because the rate is many orders of magnitude lower than the traditional elastic DM searches. The Migdal result is a world-leading limit below $0.1~\mathrm{GeV}$. Both limits have a ceiling to the sensitivity due to shielding of dark matter from the Earth and atmosphere. |
|