| All results assume a relic DM density of ρDM = 0.3 GeV/cm3. All limits are at 90% confidence level (C.L.). mDM is the DM mass. More detailed information on the assumed DM models and astrophysical parameters can be found in the US Cosmic Visions Community Report. | ||||
| Result | Topic | Last Updated | Download | Comments |
|---|---|---|---|---|
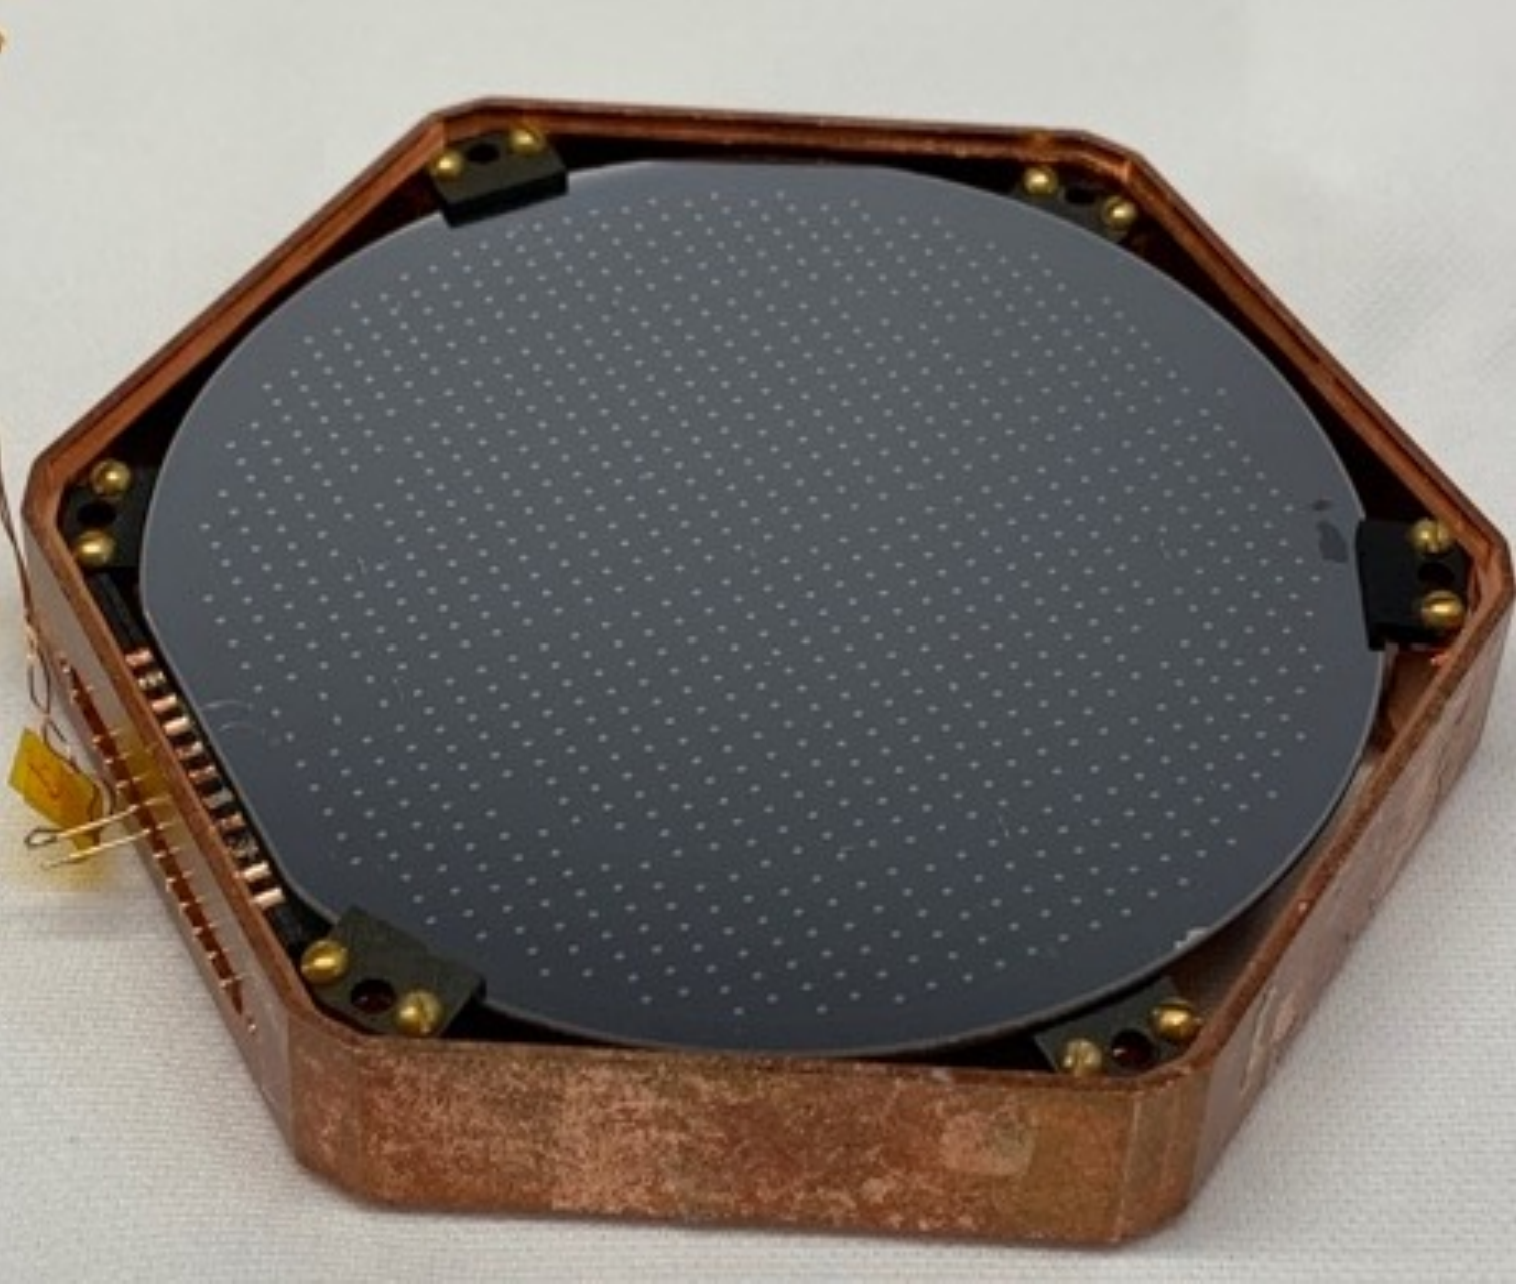 |
Experimental Setup | December 02, 2019 | png, pdf | Photo of CPD
The sensor side of CPD, showing the distributed channel of W TESs. |
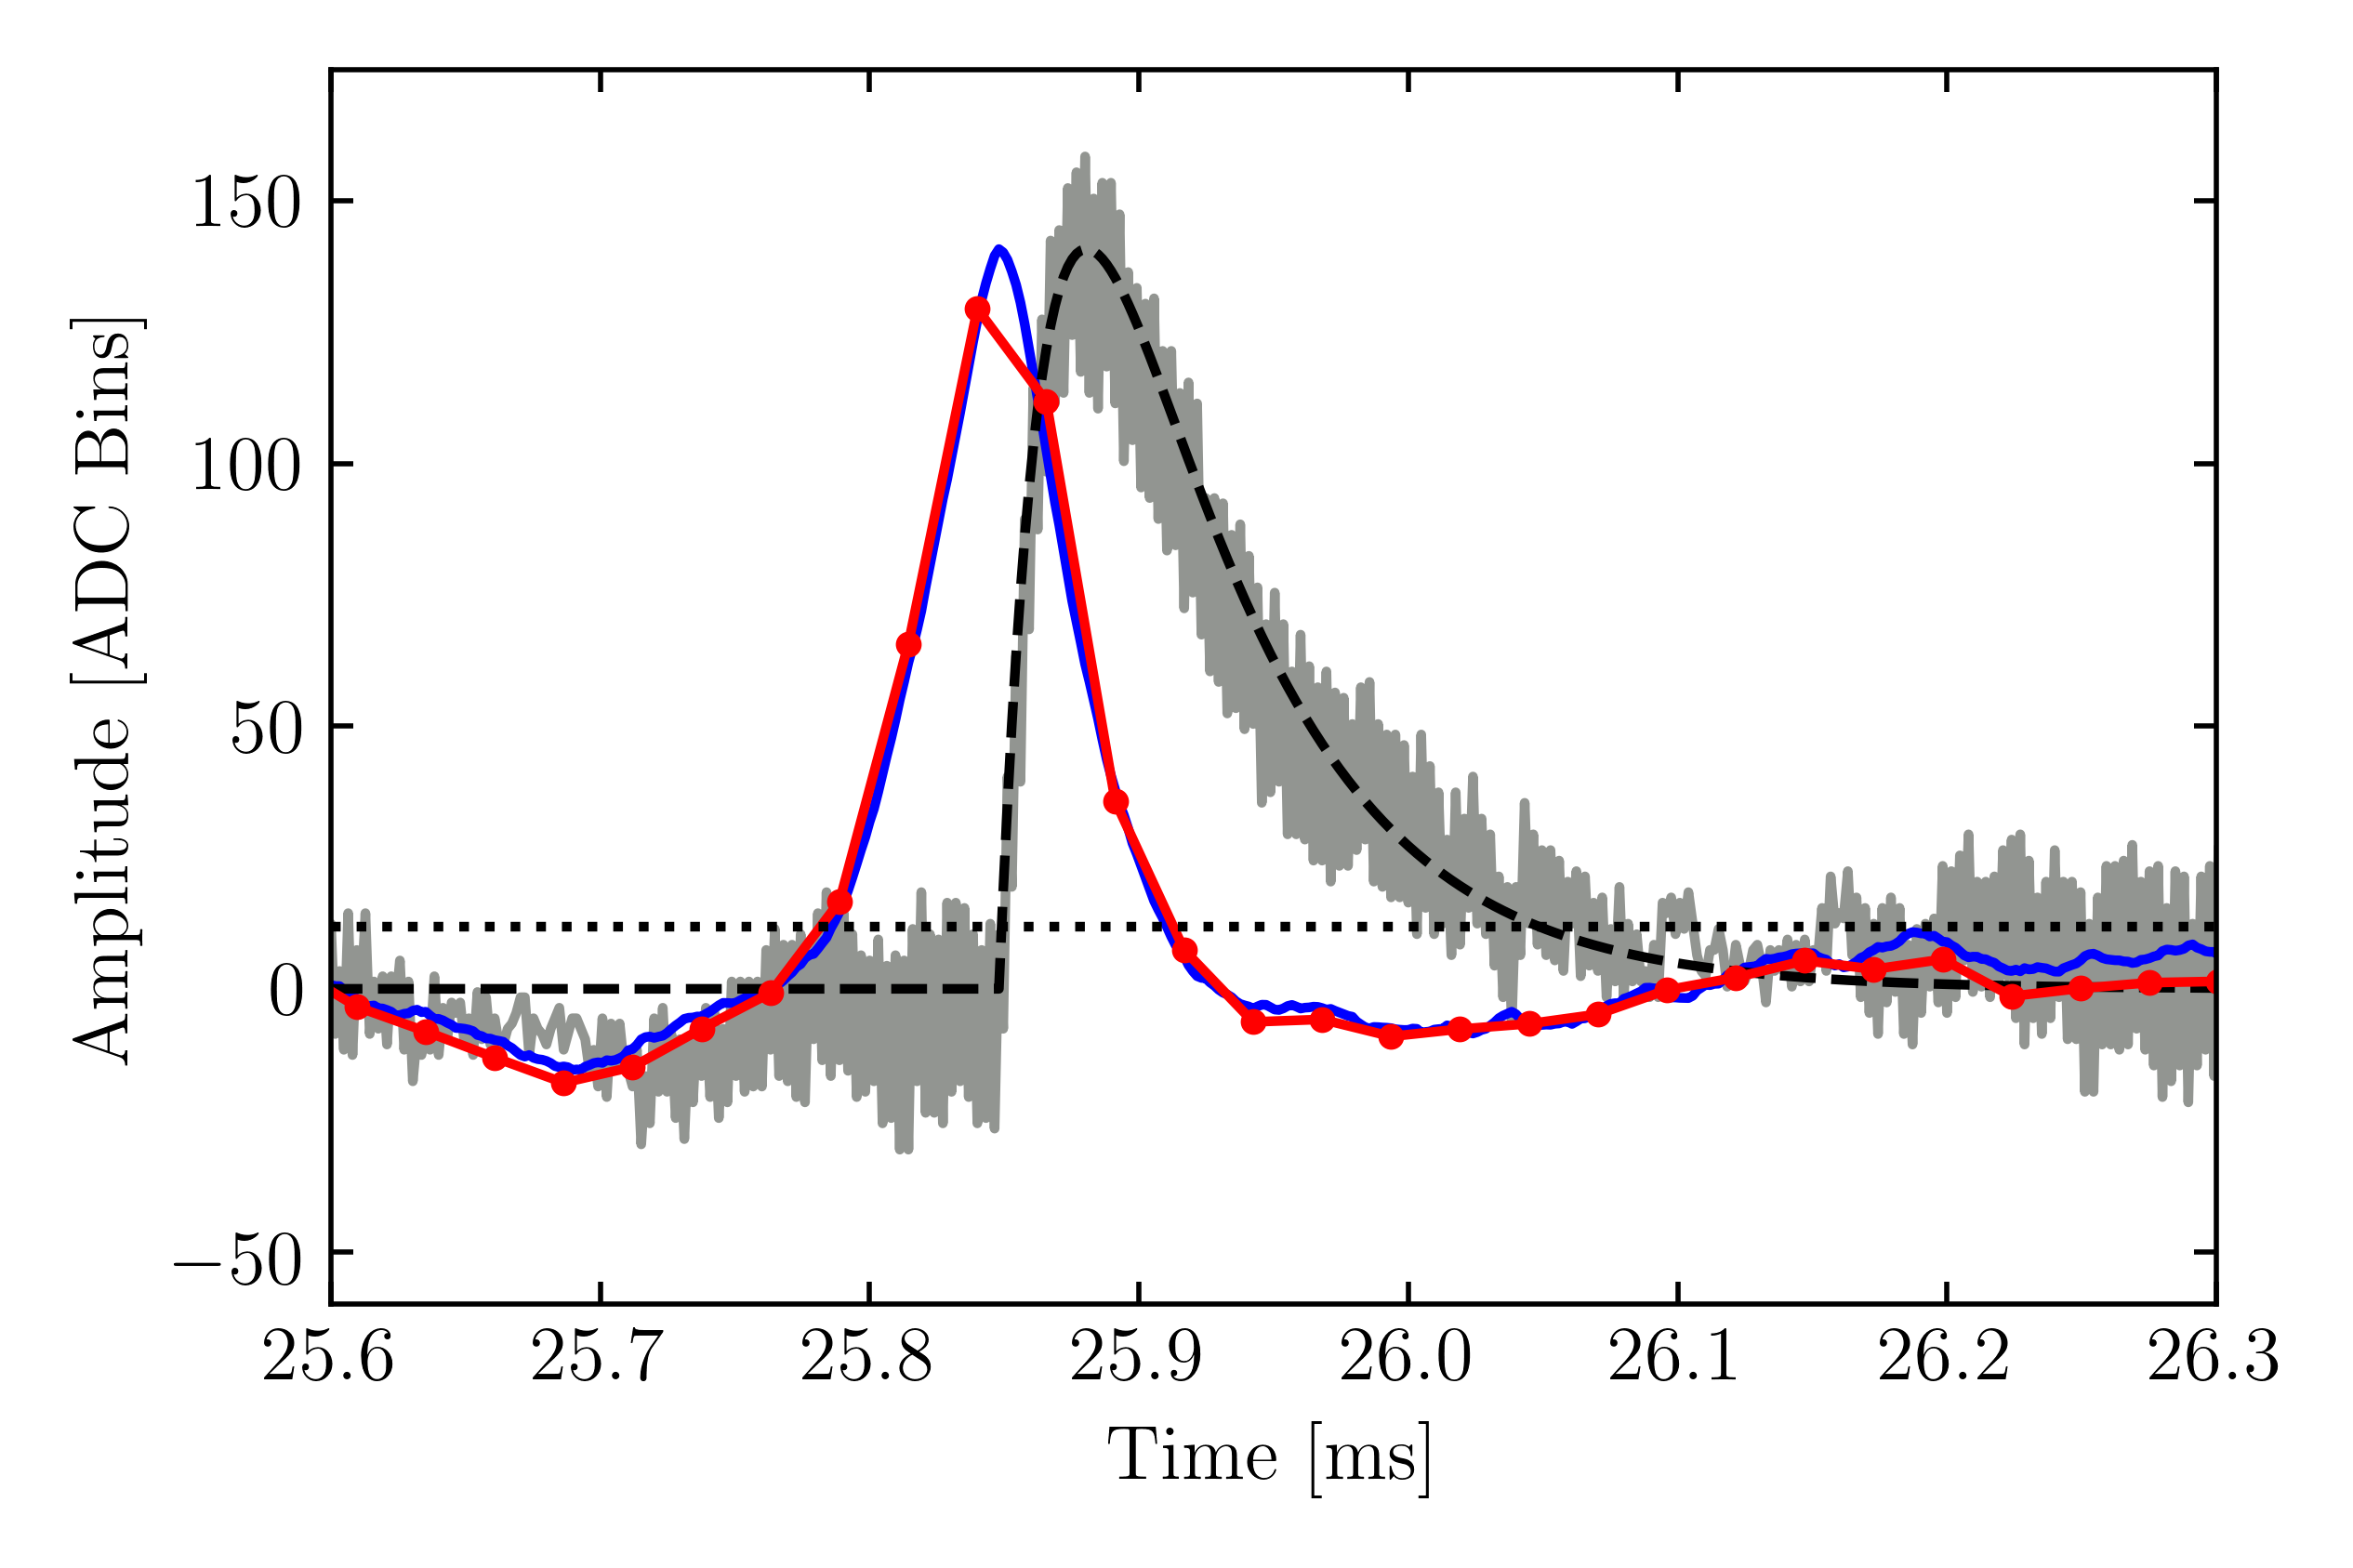 |
Data Acquisition | February 04, 2021 | png, pdf, eps | Comparison of Offline OF and FPGA Amplitudes
We have plotted a zoomed-in portion of an example pulse. The grey line is the raw pulse, the blue line is the Optimum Filter (OF) result, the black dotted line is the fit result from the OF using our pulse template, the red line with dots is the FPGA filter result, and the black dashed line is the FPGA trigger treshold. We see that the Optimum Filter and the FPGA filters are highly correlated, but not exactly the same. |
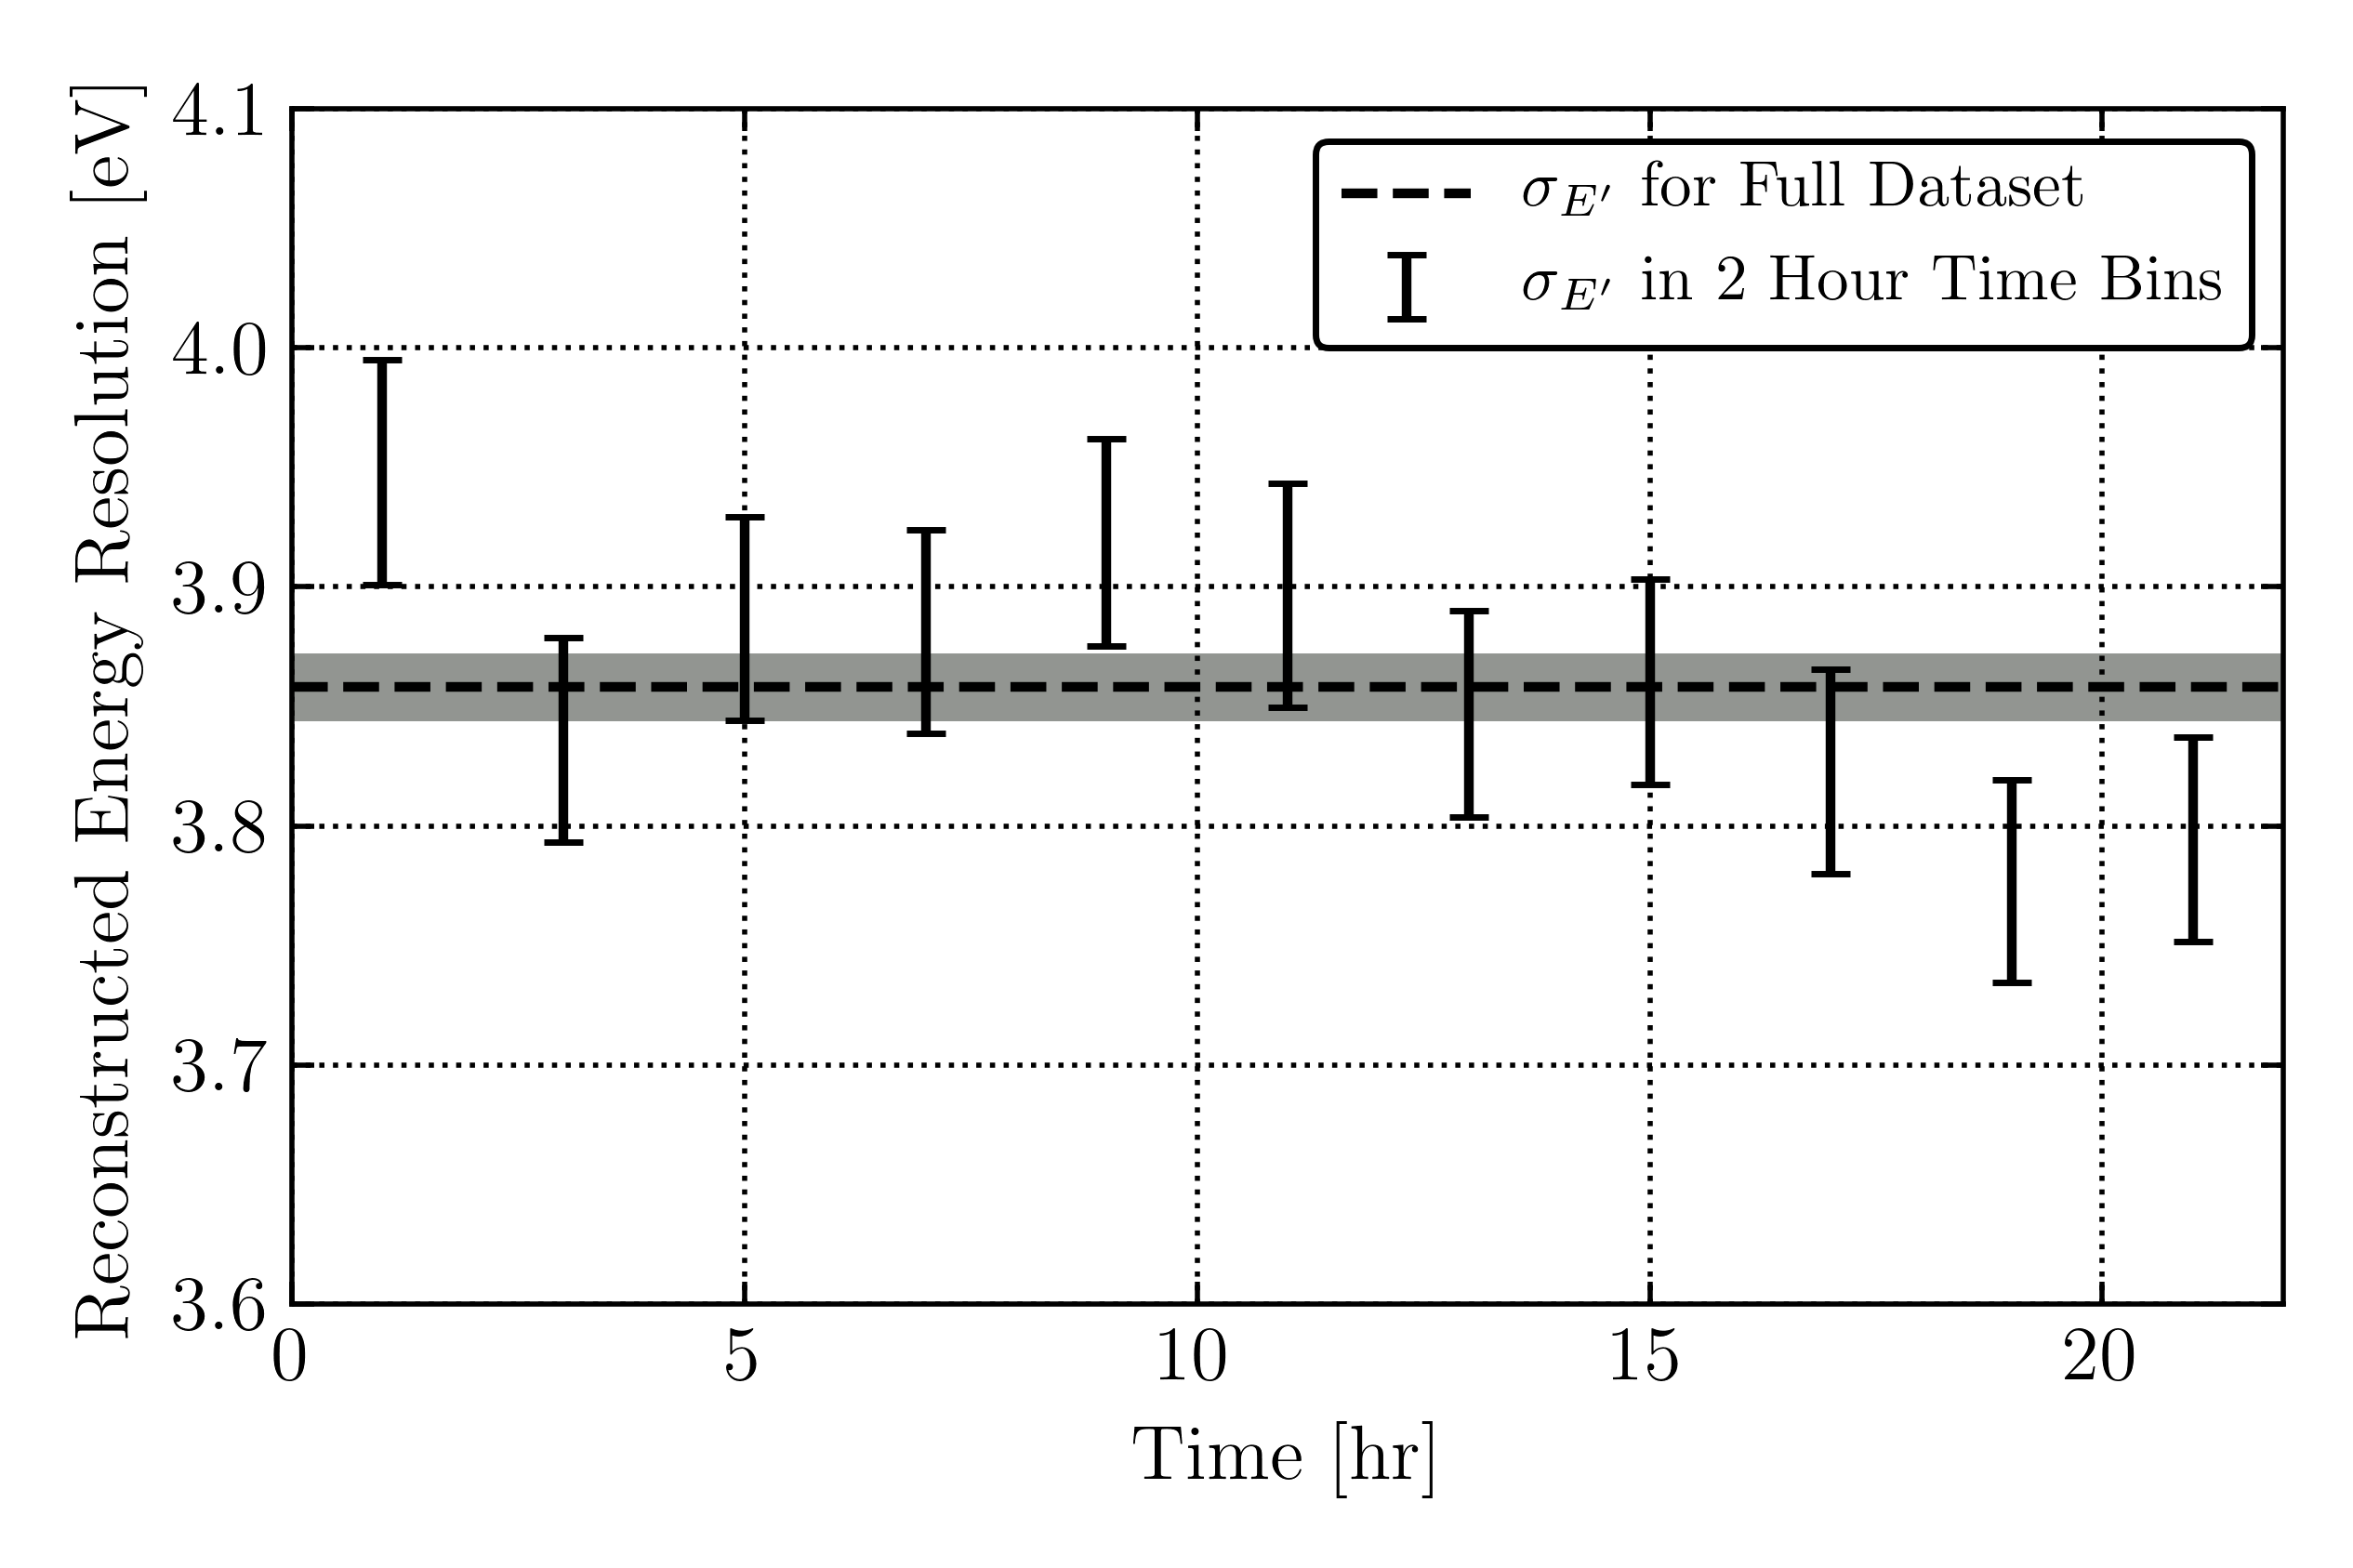 |
Detector Response | February 04, 2021 | png, pdf, eps | Phonon Resolution Over Time
Using the in-run randomly triggered events, we have calculated the energy resolution of the reconstructed energy (i.e. calibrated OF amplitude) for two-hour sections of the data, which are shown in the plot as black error-bar markers (where the error is of the 1-sigma level). We have also plotted the energy resolution for the entire run as the black dashed line with 68% C.L. bands. Their agreement over time represents the stability of the system. |
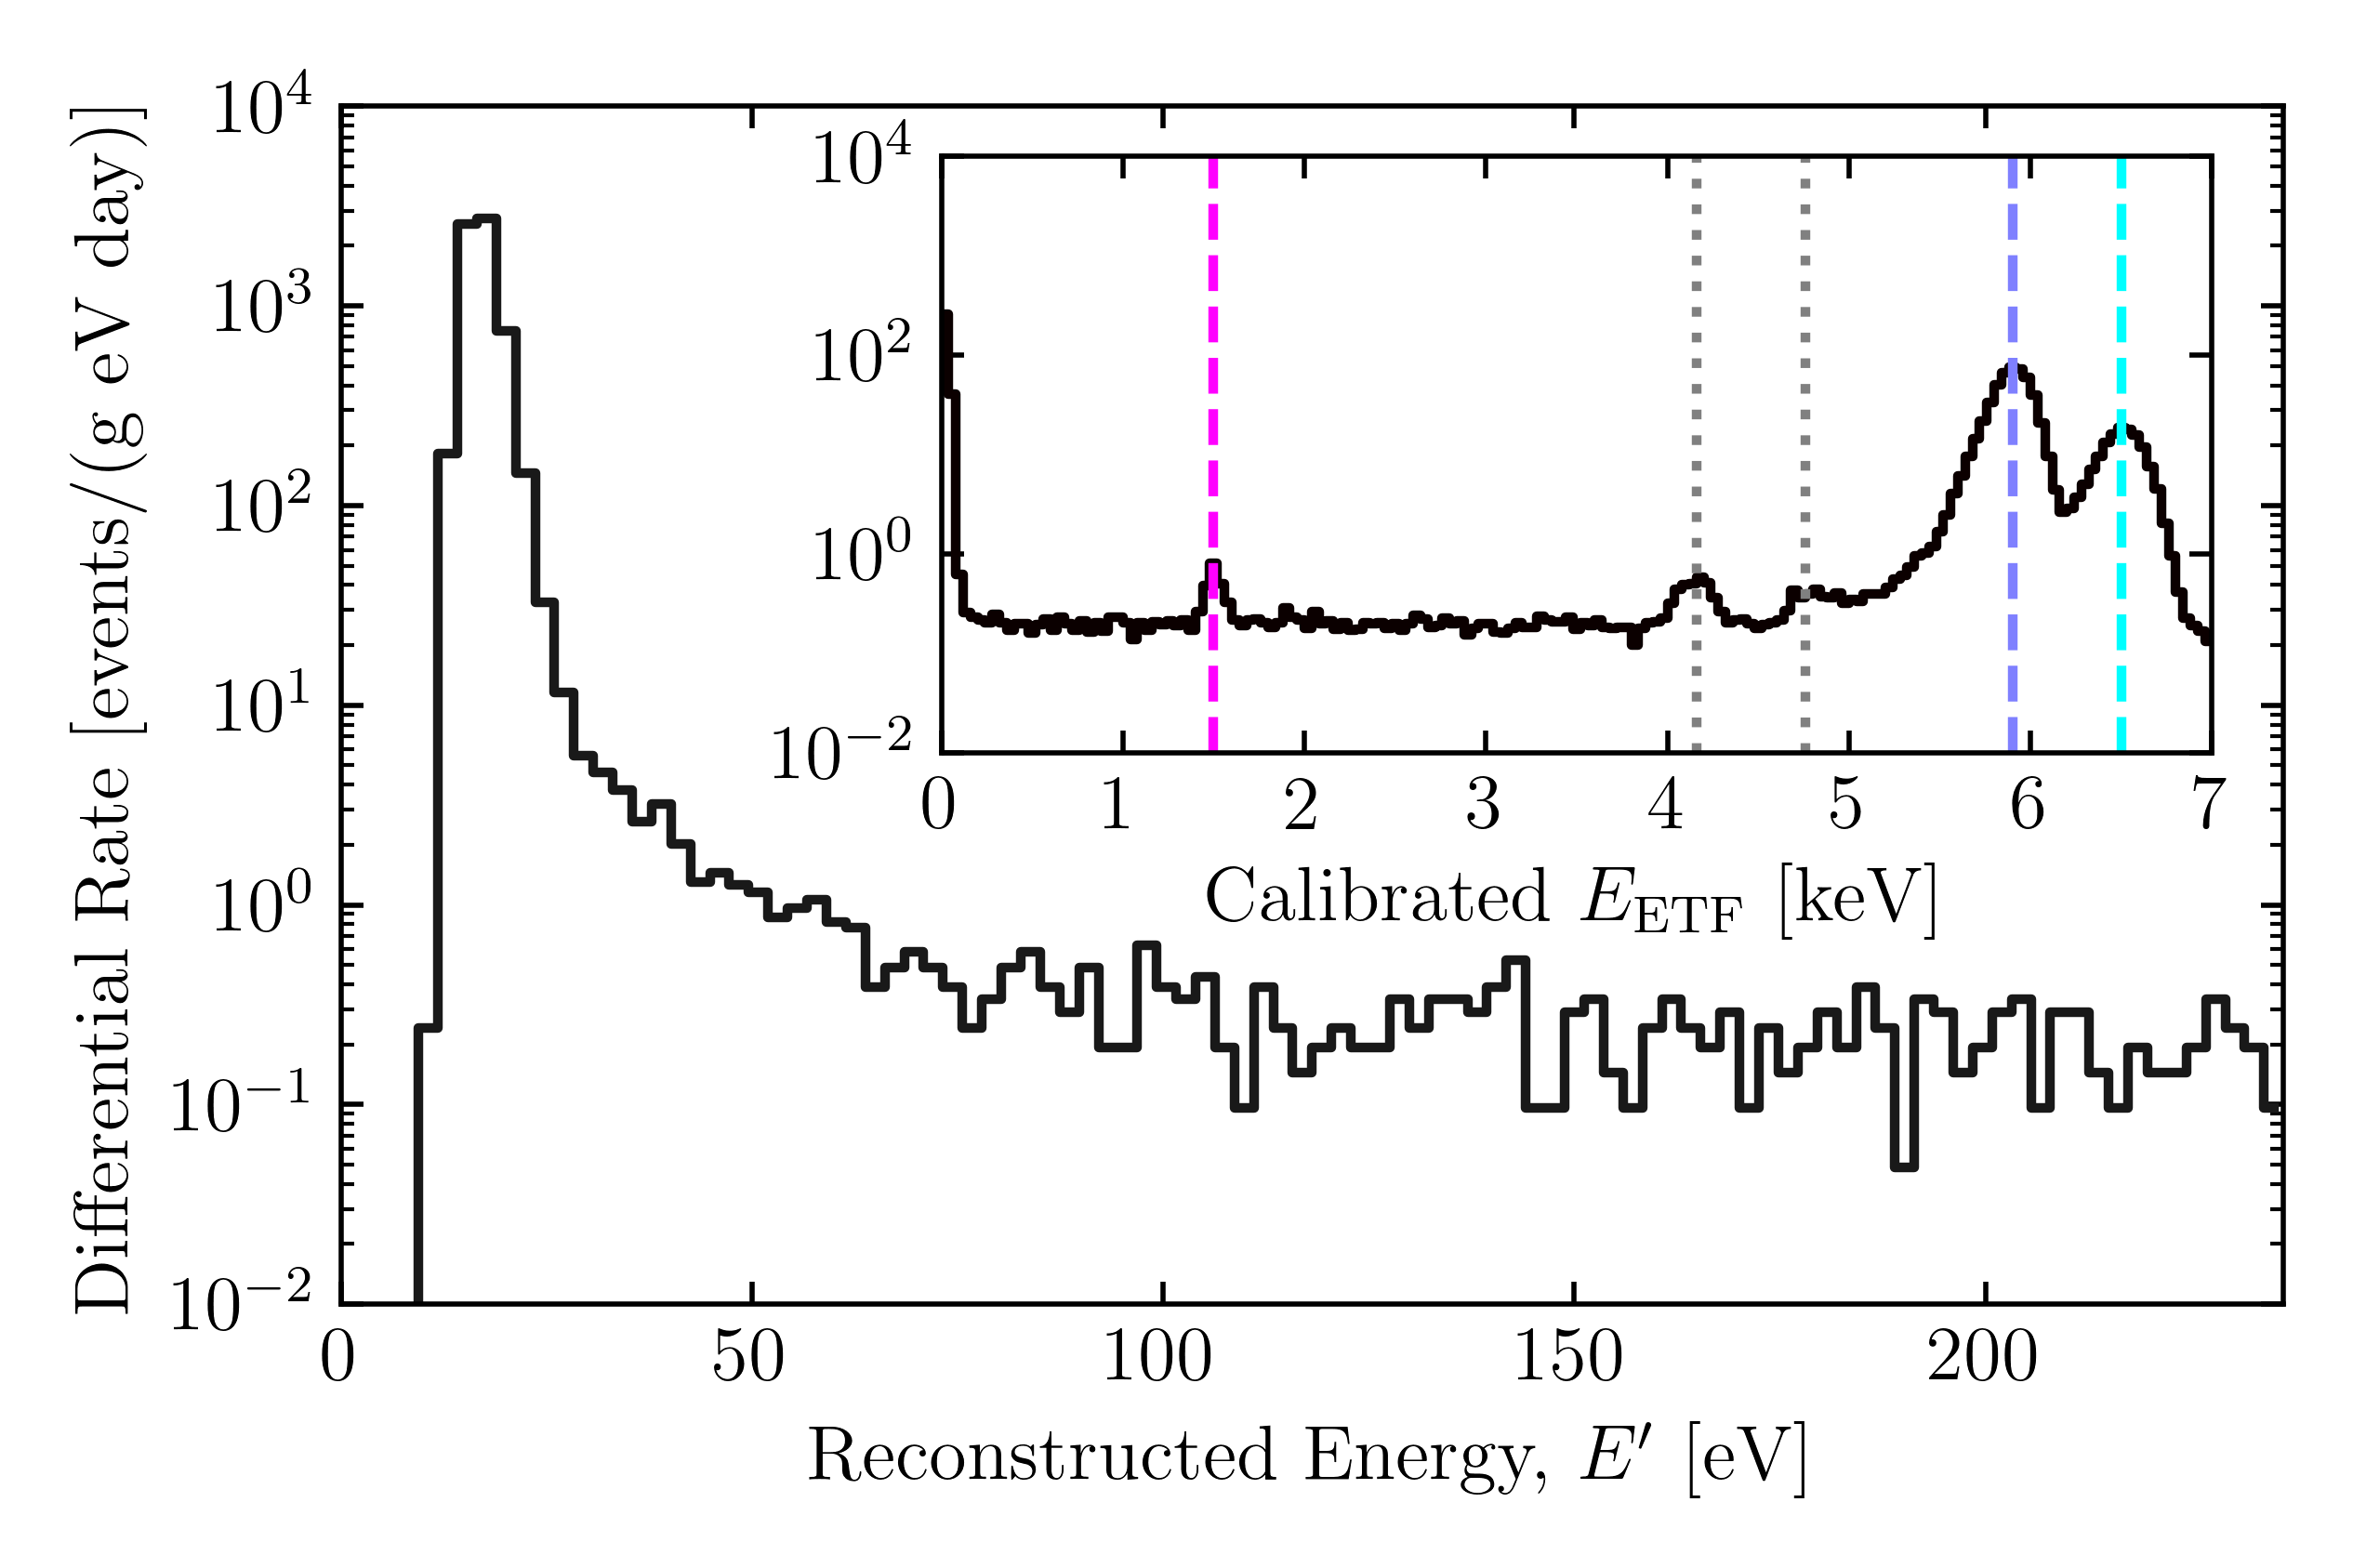 |
Data Spectrum | February 04, 2021 | png, pdf, eps | Calibration Spectrum
Energy spectrum recorded throughout the DM search data in the region-of-interest (ROI) after quality cuts. The data have been normalized in events per gram per day per eV and have been corrected for the passage fraction of the baseline and chi-square quality cuts. The inset plot shows the full spectrum up to 7 keV in calibrated EETF, showing the different available calibration peaks: Al-fluorescence at 1.5 keV (pink), Fe-55 K-α at 5.9 keV (blue), Fe-55 K-β at 6.5 keV (cyan). Also note that the two dotted grey lines correspond to the Si escape peaks, and their locations in this plot match with expectation. |
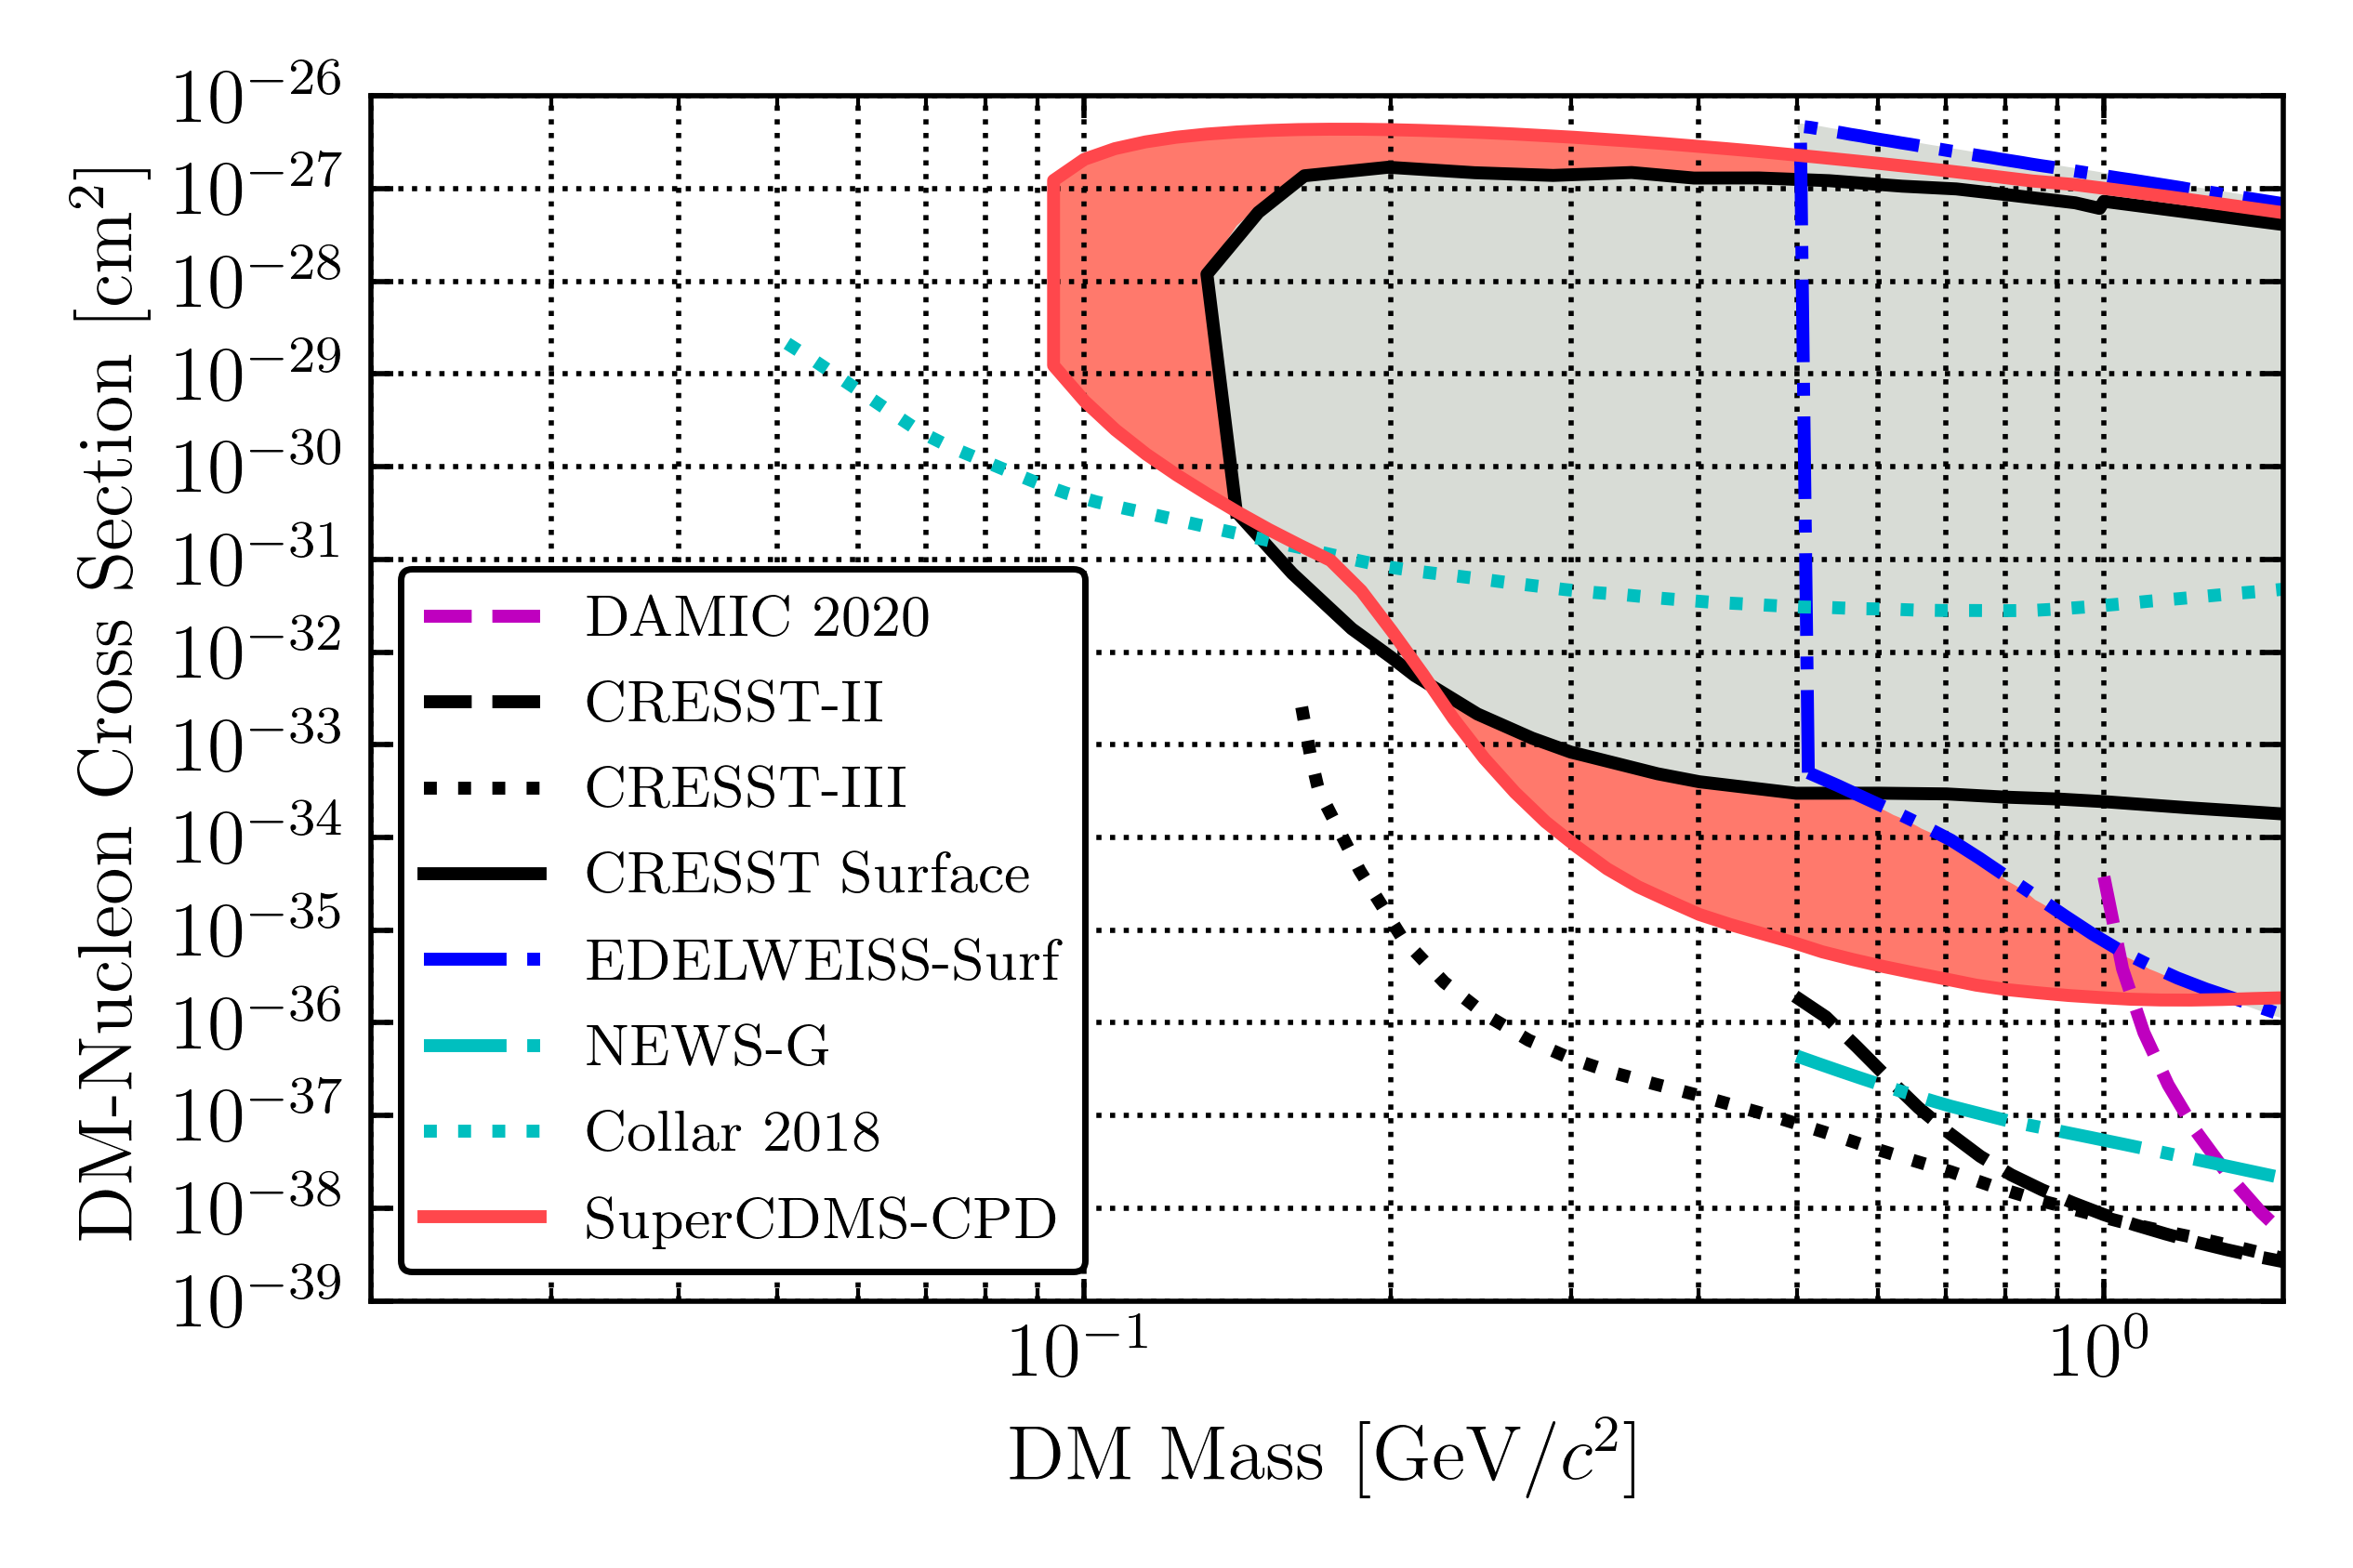 |
Exclusion Limit | March 29, 2021 | png, pdf, eps | Exclusion Limit Set by LAPD
The 90% C.L. limits on the cross section for spin-independent DM interactions with nucleons as a function of DM mass from various searches in the plotted range of parameter space (the right x-limit is 1.35 GeV/c2). This work is shown as the solid, red line. Other results shown are from CDMSlite, the CRESST surface search, CRESST-II, CRESST-III, EDELWEISS-Surf, NEWS-G, and Collar 2018. The previously excluded parameter space from searches with an overburden calculation are shown as the grey contour. The additional parameter space excluded (for searches with an overburden calculation) by this search is shown as the red contour. |
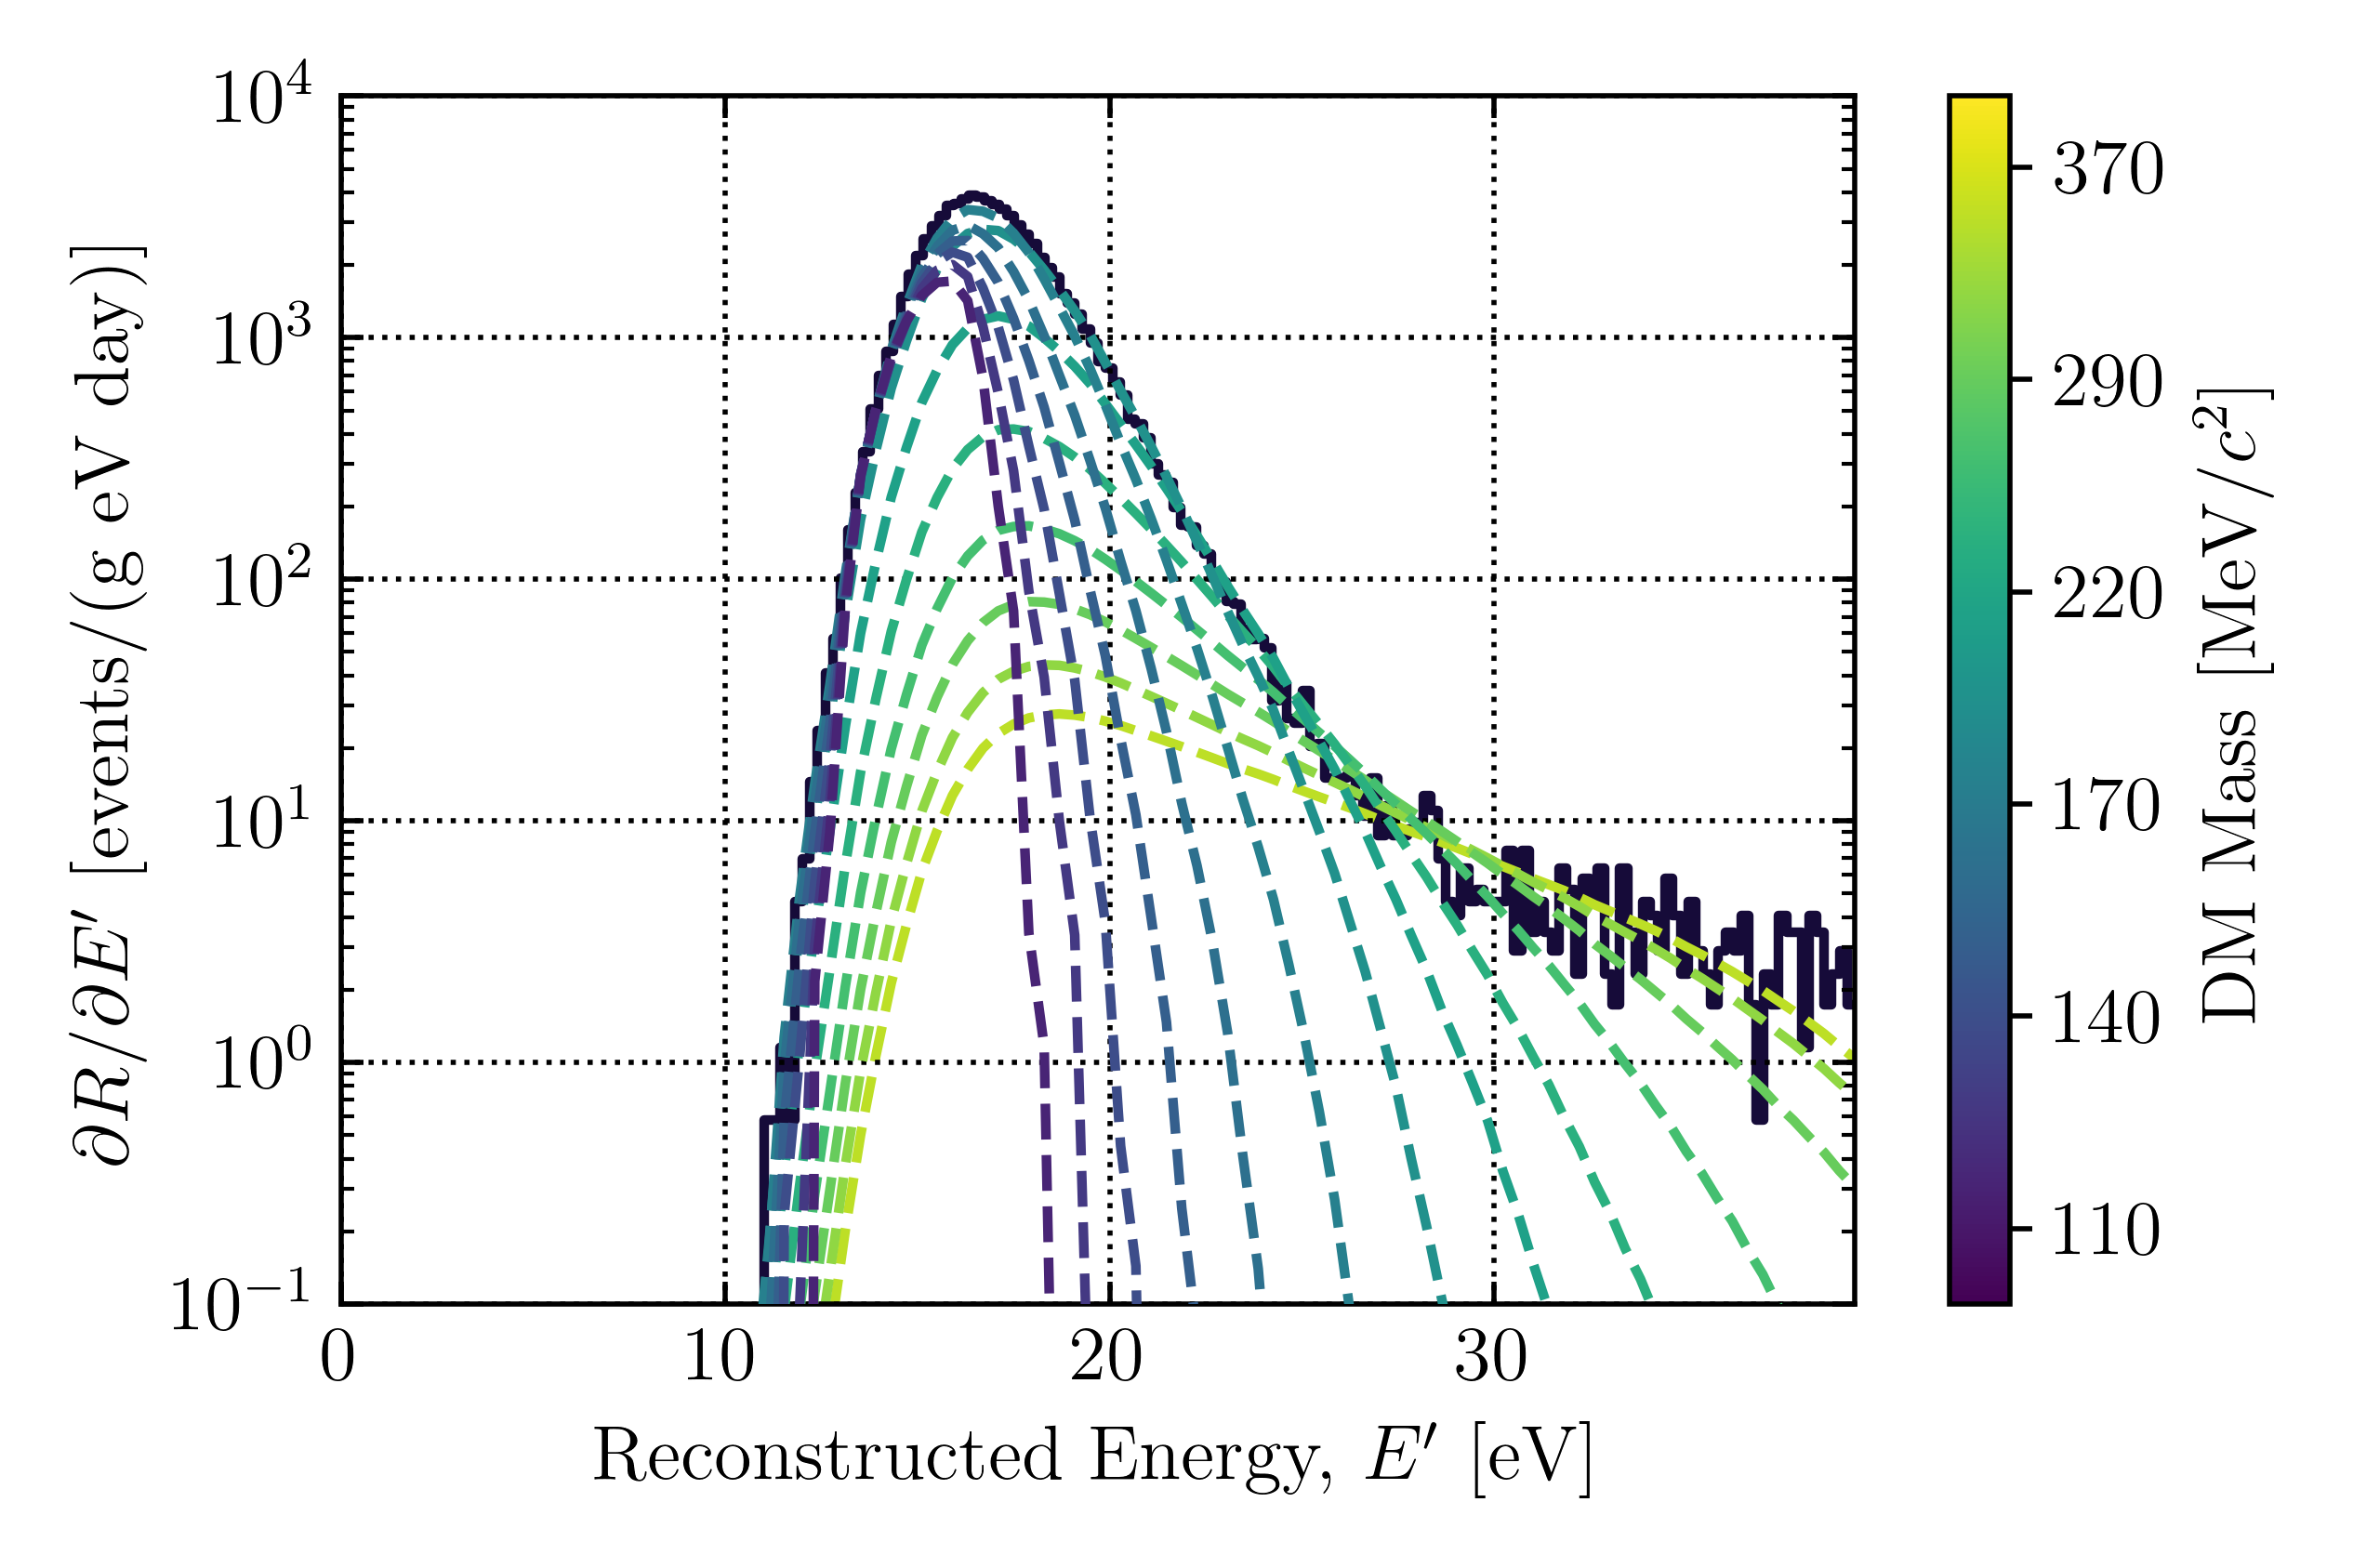 |
Data Spectrum | March 29, 2021 | png, pdf, eps | Signal Model for Various DM Masses
The event spectrum for the DM search data below 40 eV in reconstructed energy. The data have been normalized in events per gram per day per eV and have been corrected for the passage fraction of the baseline and chi-square quality cuts. The colored, dashed lines represent the calculated event rate for selected DM cross sections and masses from the 90% C.L. upper limit, where the optimum intervals in recoil energy are below 40 eV. These curves are taken from a single simulation for demonstrative purposes. Sensitivity to DM masses below 400 MeV/c2 corresponds to recoil energies below 40 eV, with the lowest masses requiring energy sensitivity down to about 15 eV. |