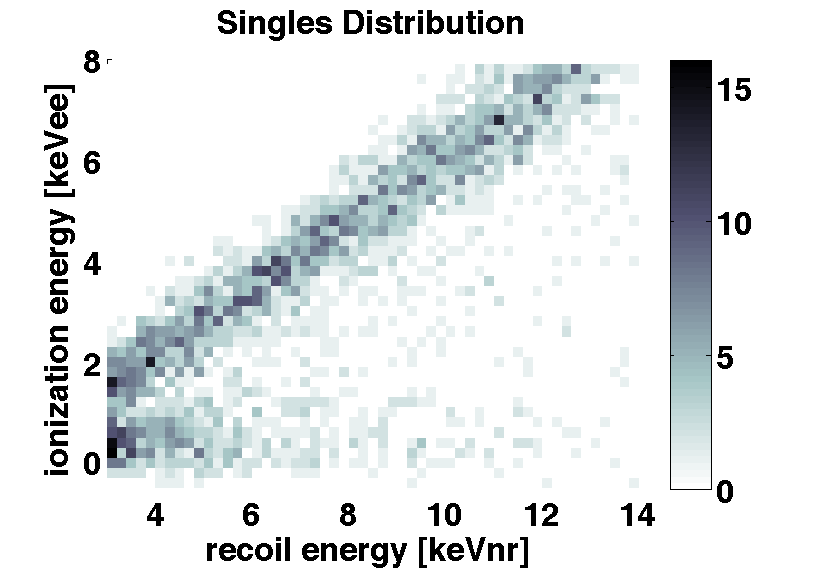
Figure 1: Singles Distribution, all detectors
The data for phase I of the data release for the CDMS-II low threshold analysis/search for annual modulation was extracted from CDMS-II data from 2006-2008.
The release includes:
The ER, NR, and ZC bands provided for each detector in this release are based on the livetime-weighted averages of the run-by-run bands used in the CDMS-II low threshold PRL (10.1103/PhysRevLett.106.131302). The +/- 2-sigma bands for each detector have been fit with third-order polynomials, and the coefficients to these fits are provided as part the data release. The definitions of the ER and NR run-by-run bands are described in section 4.5 of the thesis of D. Moore (D. Moore 2012). The energy-independent zero charge band approximation, which also assumes a Gaussian spread in ionization energy, is discussed briefly on pages 129- 130 of that thesis. In this distribution, the ZC band is simply assumed to be all events lying within +/-2-sigma of the mean of the baseline noise distribution.
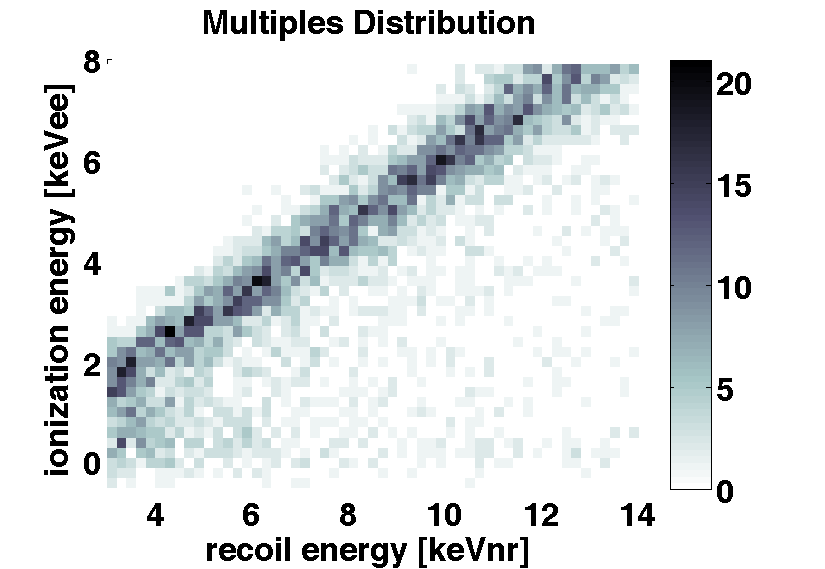
In addition to the data described above, the release also includes a file for verifying the number of events in each band ("Event_Numbers.txt") and a MATLAB-based plotting routine to reproduce the following plots for the end user. Figure 1 shows the 2-dimensional histogram for the nuclear recoil and ionization distributions of the single-scatter events for all eight low threshold detectors, while Figure 2 shows the same distributions for the multiple-scatter events. Visible in thse plots are the events in the electron recoil band, the nuclear recoil band, and the zero charge band; the latter strongly overlaps with the NR band and contributes significantly to the background in low threshold analyses.
Figure 1: Singles Distribution, all detectors |
Figure 2: Multiples Distribution, all detectors |
|
|
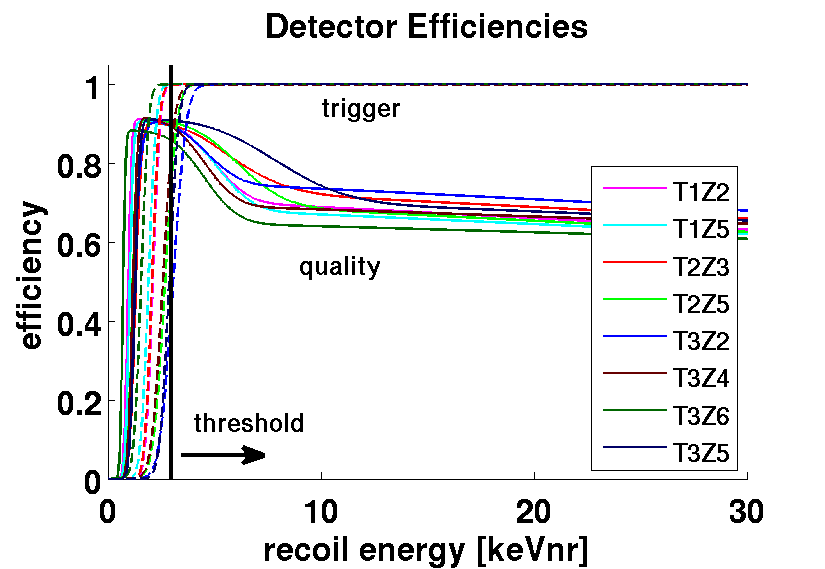
| Figure 3 shows the data quality and trigger efficiencies for each of the eight detectors as a function of energy. In particular, it highlights the threshold and the rise in efficiency at low keVnr due to relaxation of the cuts at low energies. | Figure 3. Data quality and trigger efficiencies vs. energy, by detector |
 |