International Committee for
Future Accelerators (ICFA)
Standing Committee on
Inter-Regional Connectivity (SCIC)
Chairperson: Professor Harvey
Newman, Caltech
ICFA SCIC Network Monitoring
Report
Prepared by the ICFA SCIC
Monitoring Working Group
On behalf of the Working
Group:
Les Cottrell cottrell@slac.stanford.edu

January
2006 Report of the ICFA-SCIC Monitoring Working Group
Edited by R. Les Cottrell and Aziz A. Rehmatullah on behalf of the ICFA-SCIC Monitoring WG
Created January 18, 2006. Last Update February 2, 2006
ICFA-SCIC Home Page | Monitoring WG Home Page
This report is available from http://www.slac.stanford.edu/xorg/icfa/icfa-net-paper-jan06/
Contents:
Executive Overview | Introduction
| Goals | Methodology
| PingER Results | Comparison
between Africa and South Asia| A View From
Africa | A Case Study on Pakistan
| IEPM Results |
Comparison with HEP Needs | New Monitoring and Diagnostic Efforts in HEP | Comparisons with Economic
Indicators | Accomplishments
since Last Report | Efforts for
Better PingER Management | Recommendations |
Appendix: Countries in PingER
Database | References
Internet performance is improving each year with packet losses typically improving by 40-50% per year and losses by 25%-45% per year, and for some regions such as S. E. Europe, even more. Geosynchronous satellite connections are still important to countries with poor telecommunications infrastructure. However, the number of countries with fiber connectivity has and continues to increase and in most cases, satellite links are used as backup or redundant links. In general for HEP countries satellite links are being replaced with land-line links with improved performance (in particular for RTT). On the other side of the coin number of Internet usage is increasing (see http://www.internetworldstats.com/stats.htm), the application demands (see for example [bcr]) are growing and the expected reliability is increasing, so we cannot be complacent.
In general, throughput measured from within a region is
much higher than when measured from outside. Links between the more developed
regions including Anglo America,
Africa and
For modern HEP collaborations and Grids there is an increasing need for high-performance monitoring to set expectations, provide planning and trouble-shooting information, and to provide steering for applications.
There is a positive correlation between the various economic and development indices. Besides being useful in their own right these indices are an excellent way to illustrate anomalies and for pointing out measurement/analysis problems. The large variations between sites within a given country illustrate the need for careful checking of the results and the need for multiple sites/country to identify anomalies.
To quantify and help bridge the Digital Divide, enable
world-wide collaborations, and reach-out to scientists world-wide, it is
imperative to continue and extend the PingER monitoring coverage to all
countries with HEP programs and significant scientific enterprises. On the
other hand, more support is required from these countries to enable adding more
sites to PingER. Based on a few weeks of data, we have tried to highlight the
problems in
The formation of this working group was requested at the ICFA/SCIC meeting at CERN in March 2002 [icfa-mar02]. The mission is to: Provide a quantitative/technical view of inter-regional network performance to enable understanding the current situation and making recommendations for improved inter-regional connectivity.
The lead person for the monitoring working group was identified as Les Cottrell. The lead person was requested to gather a team of people to assist in preparing the report and to prepare the current ICFA report for the end of 2002. The team membership consists of:
Table 1: Members of the ICFA/SCIC Network Monitoring team
|
Les Cottrell |
SLAC |
US |
cottrell@slac.stanford.edu |
|
|
|
|
|
|
Sergei Berezhnev |
RUHEP, |
|
sfb@radio-msu.net |
|
Sergio F. Novaes |
FNAL |
|
novaes@fnal.gov |
|
Fukuko Yuasa |
KEK |
|
Fukuko.Yuasa@kek.jp |
|
Sylvain Ravot |
Caltech |
CMS |
Sylvain.Ravot@cern.ch |
|
Shawn McKee |
|
I2 HEP Net Mon
WG |
- Obtain as uniform picture as possible of the present performance of the connectivity used by the ICFA community
- Prepare reports on the performance of HEP connectivity, including, where possible, the identification of any key bottlenecks or problem areas.
This report may be regarded as a follow on to the May 1998 Report of the ICFA-NTF Monitoring Working Group [icfa-98], the January 2003 Report of the ICFA-SCIC Monitoring Working Group [icfa-03] the January 2004 Report of the ICFA-SCIC Monitoring Working Group [icfa-04] and the January 2005 Report of the ICFA-SCIC Monitoring Working Group [icfa-05]. The current report updates the January 2005 report, but is complete in its own right in that it includes the tutorial information from the previous reports.
There are two complementary types of Internet monitoring reported on in this report.
- In the first we use PingER [pinger] which uses the ubiquitous "ping" utility available standard on most modern hosts. Details of the PingER methodology can be found in the May 1998 Report of the ICFA-NTF Monitoring Working Group [icfa-98] and [ejds-pinger]. PingER provides low intrusiveness (~ 100bits/s per host pair monitored1) Round Trip Time (RTT), loss, reachability (if a host does not respond to a set of 21 pings it is presumed to be non-reachable). The low intrusiveness enables the method to be very effective for measuring regions and hosts with poor connectivity. Since the ping server is pre-installed on all remote hosts of interest, minimal support is needed for the remote host (no software to install, no account needed etc.)
- The second method (IEPM-BW [iepm]) is for
measuring high network and application throughput between hosts with
excellent connections. Examples of such hosts are to be found at HEP accelerator
sites and tier 1 and 2 sites, major Grid sites, and major academic and
research sites in Anglo America2,
The PingER data and results extend back to the start of 1995. They thus provide a valuable history of Internet performance. PingER has 34 monitoring nodes in 14 regions, that monitor 1037 remote nodes at over 750 sites in around 120 countries (see PingER Deployment [pinger-deploy]). These countries contain over 90% of the world's population (see Table 2) and over 99% of the online users of the Internet. Most of the hosts monitored are at educational or research sites. We try and get at least 2 hosts per country to help identify and avoid anomalies at a single host, although we are making efforts to increase the number of monitoring hosts to as many as we can. The requirements for the remote host can be found in [host-req]. Fig. 1 below shows the locations of the monitoring and remote (monitored sites).
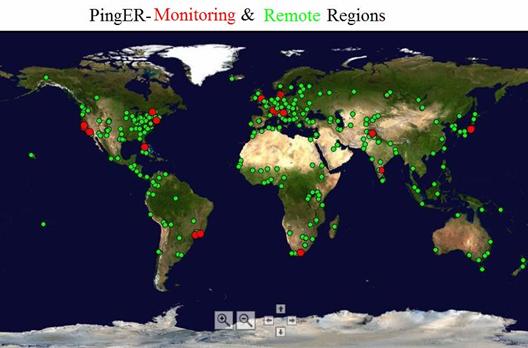
Figure 1: Locations of PingER
monitoring and remote sites as of Jan 2006.
There are around thirty seven hundred monitoring/monitored-remote-host pairs, so it is important to provide aggregation of data by hosts from a variety of "affinity groups". PingER provides aggregation by affinity groups such as HEP experiment collaborator sites, Top Level Domain (TLD), Internet Service Provider (ISP), or by world region etc. The world regions, as defined for PingER, and countries monitored are shown below in Fig. 2. The regions are chosen starting from the U.N. definitions [un]. We modify the region definitions to take into account which countries have HEP interests and to try and ensure the countries in a region have similar performance.
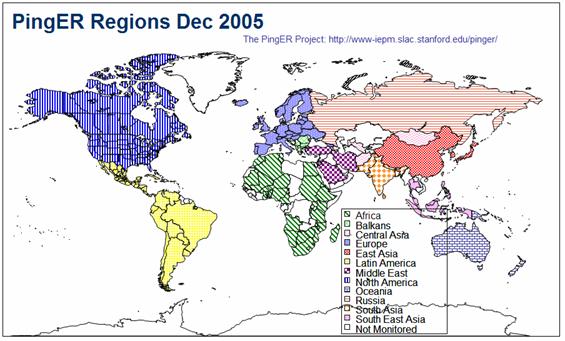
Figure 2: Major regions of the world for PingER aggregation by regions
More details on the regions are provided in Table 2 that highlights the number of countries monitored in each of these regions, and the distribution of population in these regions.
Table 2: Countries and populations by region
|
Regions |
# of
Countries |
% of
World Population |
% of
Monitored Population |
|
|
31 |
11.5 |
12.8 |
|
Balkans |
9 |
1.0 |
1.1 |
|
|
4 |
1.0 |
1.1 |
|
|
25 |
7.9 |
8.8 |
|
|
18 |
8.2 |
9.1 |
|
|
2 |
5.1 |
5.7 |
|
|
4 |
23.2 |
25.9 |
|
|
6 |
6.2 |
6.9 |
|
|
5 |
22.5 |
25.0 |
|
|
5 |
2.8 |
3.1 |
|
|
5 |
0.5 |
0.5 |
|
|
1 |
2.2 |
2.5 |
To assist in interpreting the results in terms of their impact on well-known applications, we categorize the losses into quality ranges. These are shown below in Table 3.
|
Table 3: Quality ranges used for loss |
||||||
|
|
Excellent |
Good |
Acceptable |
Poor |
Very Poor |
Bad |
|
Loss |
<0.1% |
>=0.1% & |
> =1% |
>= 2.5% |
>= 5% |
>= 12% |
More on the effects of packet loss and RTT can be found in the Tutorial on Internet Monitoring & PingER at SLAC [tutorial], briefly:
- At losses of 4-6% or more video-conferencing becomes irritating and non-native language speakers become unable to communicate. The occurrence of long delays of 4 seconds (such as may be caused by timeouts in recovering from packet loss) or more at a frequency of 4-5% or more is also irritating for interactive activities such as telnet and X windows. Conventional wisdom among TCP researchers holds that a loss rate of 5% has a significant adverse effect on TCP performance, because it will greatly limit the size of the congestion window and hence the transfer rate, while 3% is often substantially less serious, Vern Paxson. A random loss of 2.5% will result in Voice Over Internet Protocols (VOIP) becoming slightly annoying every 30 seconds or so. A more realistic burst loss pattern will result in VOIP distortion going from not annoying to slightly annoying when the loss goes from 0 to 1%. Since TCP throughput for the standard (Reno based) TCP stack goes as 1/(sqrt(loss) [mathis]) (see M. Mathis, J. Semke, J. Mahdavi, T. Ott, "The Macroscopic Behavior of the TCP Congestion Avoidance Algorithm",Computer Communication Review, volume 27, number 3, pp. 67-82, July 1997), it is important to keep losses low for achieving high throughput.
- For RTTs, studies in the late 1970s and early 1980s showed that one needs < 400ms for high productivity interactive use. VOIP requires a RTT of < 250ms or it is hard for the listener to know when to speak.
It must be understood that these quality designations apply to normal Internet use. For high performance, and thus access to data samples and effective partnership in distributed data analysis, much lower packet loss rates may be required.
Loss
Of the two metrics loss & RTT, loss is more critical
since a loss of a packet will typically cause timeouts that can last for
several seconds, moreover, RTT increases with increase in distance between any
two nodes and also, with the increase in the number of hops, whereas loss is
less distance dependent. For instance RTT between a node at SLAC and somewhere
in
|
|
|
Figure 3: December 2005 packet loss snapshot seen
from |
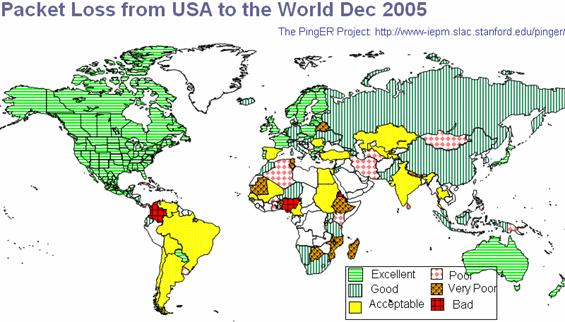
Fig. 3 shows a snapshot of the losses for December 05. We
observe that very few countries have bad connectivity. Most of N. America, Europe,
Oceania and
Another way of looking at the losses is to see how many hosts fall in the various loss quality categories defined above as a function of time. An example of such a plot is seen in Fig 4.
|
|
|
Figure 4: Number of hosts measured from SLAC for each quality category from February 1998 through December 2005. |
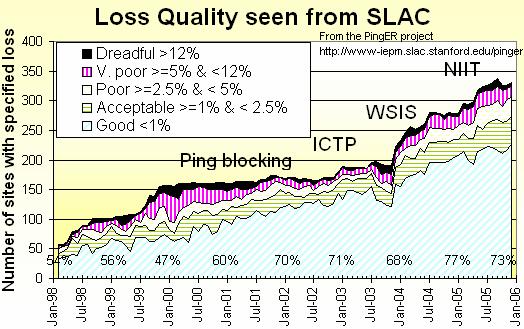
It can be seen that recently most sites fall in the good quality category. The numbers at the bottom indicate the percentage of total sites that see good or better packet loss at the start of the year. Also the number of sites with good quality has increased from about 55% to about 75% in the 9 years displayed. The plot also shows the increase in the total number of sites monitored from SLAC over the years. The improvements are particularly encouraging since most of the new sites are added in developing regions.
Towards the end of 2001 the number of sites monitored started
dropping as sites blocked pings due to
The increases in monitored sites towards the end of 2002
and early 2003 was due to help from the Abdus Salam Institute of Theoretical
Physics (ICTP). The ICTP held a Round Table meeting on Developing
Country Access to On-Line Scientific Publishing: Sustainable Alternatives
[ictp] in
The increase towards the end of 2003 was spurred by
preparations for the second Open Round Table on Developing
Countries Access to Scientific Knowledge: Quantifying the Digital Divide
23-24 November Trieste, Italy and the WSIS conference and associated activities in
The increases in 2004 were due to adding new sites
especially in Africa, S. America,
In 2005, the Pakistan Ministry Of Science and Technology
(MOST) and the US State Department funded SLAC and the National University of
Sciences and Technology’s (NUST) Institute of Information Technology (NIIT) to
collaborate on a project to improve and extend PingER. As part of this project
and the increased interest from Internet2 in “Hard to Reach Network Places”
many new sites in the South Asia and
Fig. 5 below shows the long term trends for the various regions as seen from Anglo America.
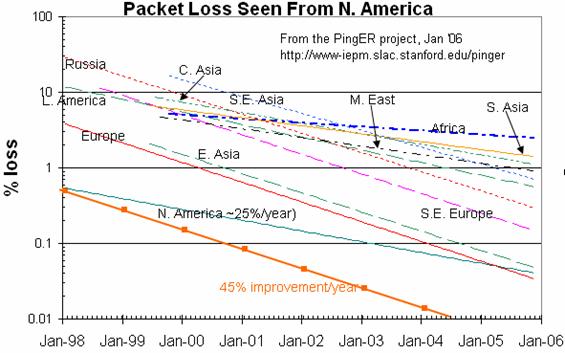
Figure 5:
Packets loss trends from Anglo America to various regions of the world.
The following general observations can be made for the losses:
- For most regions the improvement in losses is typically between 25% and 45% per year.
- The better rgions are achieving better than 1% packet for most of their sites seen from SLAC.
Fig. 6 shows the world's connected population fractions obtained by dividing countries up by loss quality seen from the US, and adding the connected populations for the countries (we obtained the population/country figures from "How many Online" [nua] for 2001 and from CIA World Factbook for 2005 [cia-pop-figures]).
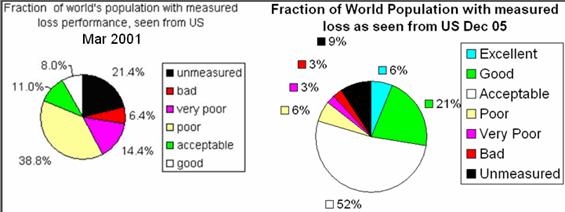
Figure 6:
Fraction of the world's connected population in countries with measured loss
performance in 2001 and Dec 2005
It can be seen that in 2001, <20% of the population lived in countries with acceptable or better packet loss. By December 2005 this had risen to 79%. The coverage of PingER has also increased from about 70 countries at the start of 2003 to over 120 in December 2005. This in turn reduced the fraction of the connected population for which PingER has no measurements. The results are even more encouraging when one bears in mind that the newer countries being added typically are from regions that have traditionally poorer connectivity.
It is interesting to compare the packet losses seen by various regions with those seen by residential DSL customers in the San Francisco Bay Area. This is shown in Fig. 7 below.
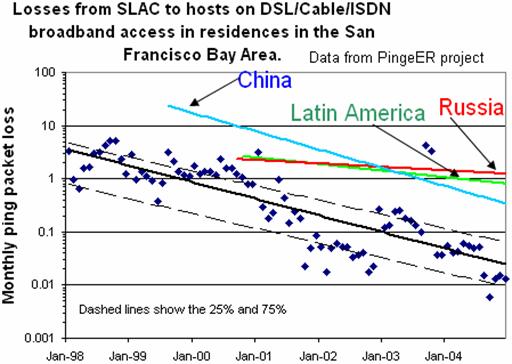
Figure 7:
Losses from SLAC to various world regions compared with that for residential
customers in the San Francisco Bay Area.
RTTs
There are limits to the minimum RTT due to the speed of
light in fibers or electricity in copper. Typically today, the minimum RTTs for
terrestrial circuits are about 2 * distance / ( 0.6 * c), or roughly
100km/ms (RTT time,) where c is the velocity of light, the factor of
2 accounts for the round-trip, 0.6*c is roughly the speed of light in
fibre. For geostationary satellites links, the minima are between 500 and
600ms. For
Fig. 8 below shows the trends of the min-RTT measured from ESnet sites in Anglo America to the various regions of the world. The straight lines are exponential fits to the data (straight lines on a log-linear plot), and the wiggly lines are moving averages for the last 6 months.
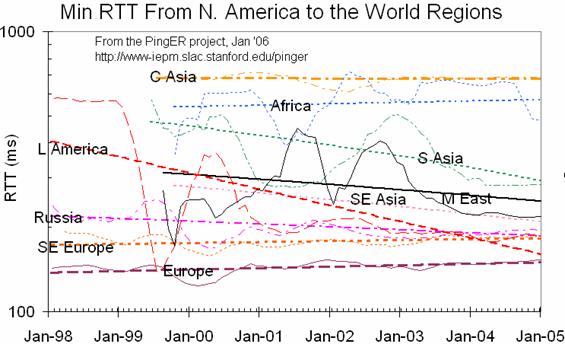
Figure 8:
Minimum RTT measured from ESnet sites in the
As is seen by comparing the exponential
fits with the moving averages, the trends here are less clear. Europe and the
Balkans and to a lesser extent Russia have been pretty stable since upgrading
the links from say 45 to 155, 622 or 2400 or 10,000 Mbps implying that for high
speed links, the actual link speeds have a small effect on the minimum RTT, the
main effect being the distance.
Fig. 9 shows the RTT from the
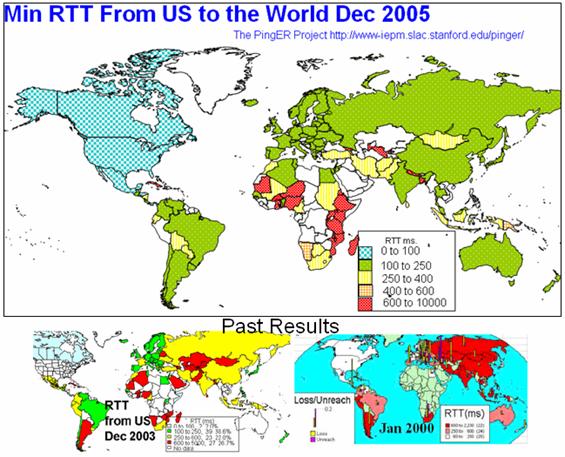
Figure 9: December 05 comparison of Minimum RTT with 2003 and 2000 results
It is seen that
the number of countries with satellite links (> 600ms RTT or dark red) has
decreased markedly in the 6 years shown. Today satellite links are used in
places where it is hard or unprofitable to pull terrestrial-lines (typically
fibers) to. Barring a few countries in Central and Eastern Africa,
Two interesting examples stand out in this data:
Throughput
We also combine the loss and RTT measurements using throughput = 1460Bytes[Max Transmission Unit]/(RTT * sqrt(loss)) from [mathis]. The results are shown in Fig. 10. The orange line shows a ~40% improvement/year or about a factor of 10 in < 7 years.
|
|
|
Figure 10: Derived throughput as a function of time seen from ESnet sites to various regions of the world. The numbers in parentheses are the number of monitoring/remote host pairs contributing to the data. The lines are exponential fits to the data. |
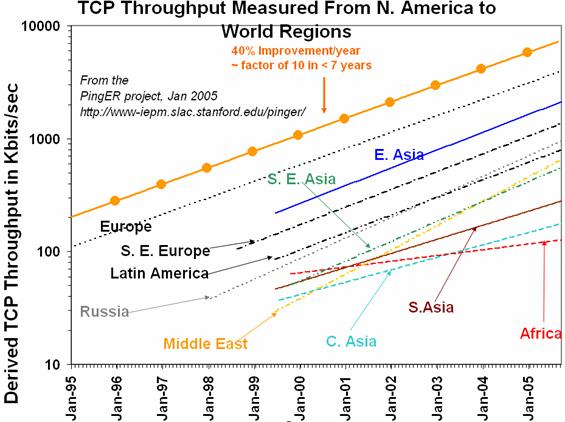
The data for several of the developing countries only
extends back for only about five years so some care must be taken in interpreting
the long term trends. With this caveat, it can be seen that links between the
more developed regions including Anglo America,
View from
To assist is developing a less N. American view of the Digital
Divide; we added many more hosts in developing countries to the list of hosts
monitored from CERN in
|
|
|
Figure 11: Derived throughputs to various regions as seen from CERN |
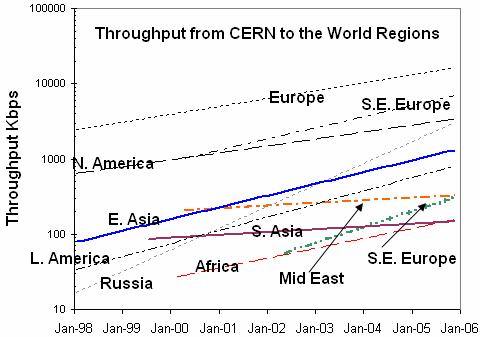
The slow increase for
Variability of performance between
and within regions
The throughput results, so far presented in this report,
have been measured from Anglo America or to a lesser extent from
Table 4: Derived throughputs in kbits/s from
monitoring hosts to monitored hosts by region of the world for December 2005
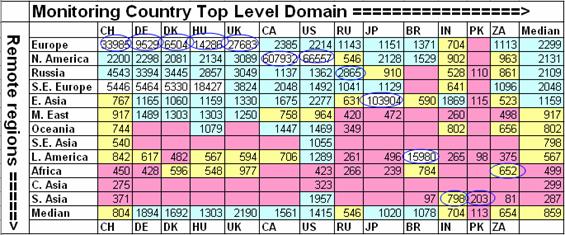
As expected it can be seen that within regions (the circled
cells) performance is generally better than between regions. Also performance
is better between closely located regions such as Europe and S. E. Europe,
To provide further insight into the variability in performance for various regions of the world seen from SLAC Fig. 12 shows various statistical measures of the losses and derived throughputs. The regions are sorted by the median of the measurement type displayed. Note the throughput graph uses a log y-scale to enable one to see the regions with poor throughput. The countries comprising a region can be seen in Fig. 2.
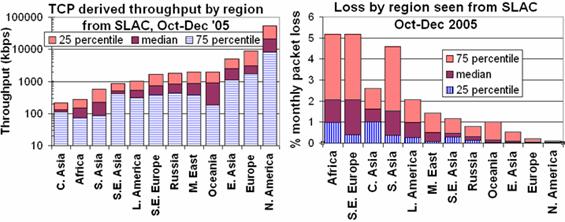
Figure 12:
25 percentile, median and 75 percentile derived throughputs and losses for
various regions measured from SLAC for Oct-Dec '05
The difference in throughput for N. America and Europe is
an artifact of the measurements being made from N. America (SLAC) which has a
much shorter RTT (roughly between a factor of 2 and 20 times or for the average sites close
to 3 to 4) to N. American than to European sites. Since the derived throughput
goes as 1/RTT this favors N.
Case
Study on NIIT,
With NIIT being an important collaborator with SLAC, Caltech and CERN, we
prepared a small case study with 3 PingER monitoring sites in
The Pakistan Education and Research Network (PERN) “is a nationwide educational intranet connecting premiere educational and research institutions of the country. PERN focuses on collaborative research, knowledge sharing, resource sharing, and distance learning by connecting people through the use of Intranet and Internet resources”.
PERN uses the services of NTC
(National Telecommunication Corporation), which is the national
telecommunication carrier for all official/government services in
Table 5: Remote sites in
|
|
Remote Node |
University Location |
Service Provider |
Traffic Enters the Country Via |
End host location |
|
|
|
|
|
|
|
|
1 |
PK.QAU.EDU.N1 |
|
NTC |
|
|
|
2 |
PK.LSE.EDU.N1 |
|
NTC |
|
|
|
3 |
PK.NIIT.EDU.N1 |
|
NTC |
|
|
|
4 |
PK.PIEAS.EDU.N1 |
|
NTC |
|
|
|
5 |
PK.SIRSYED.SSUET.N1 |
|
NTC |
|
|
|
6 |
PK.UET.EDU.N1 |
|
NTC |
|
|
|
7 |
PK.UPESH.EDU.N1 |
|
NTC |
|
|
The minimum RTT from NTC is about 5ms versus about 10-12 ms from NIIT via NTC/PERN. Presumably the extra ~5 ms is a last mile effect. From NIIT via Micronet the minimum RTT is closer to 60ms. This may be partially due to slower backbone links (it takes longer to clock the packets onto the network links) and different routes. Unfortunately we are currently unable to make traceroute measurements from the NTC host.
Looking at the average RTT results seen in Fig.13, there is a lot of variability, typically ranging from 150-400ms for the NIIT NTC/PERN host and 80-180ms for the NIIT Micronet host, and the data points for each remote host track one another closely. This indicates a common point of congestion. The NTC host results are fairly flat for each remote host, thus indicating little congestion. One can also see that the performance to the NIIT NTC/PERN connected host from NTC and from NIIT via Micronet is more variable and poorer than for the other Pakistani sites. This would appear to indicate that the congestion is located close to or at the NIIT site.
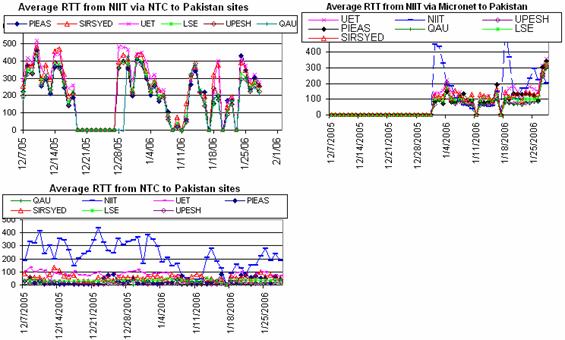
Figure 13: Average RTT from three
hosts in
The loss results shown in Fig.14
indicate that NTC has a low loss network with the packet loss percentage being
less than 1% from the NTC monitoring host to the
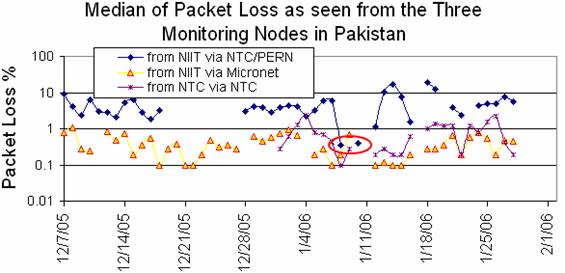
Figure14: Median packet loss from
3 hosts in
We also prepared a case study on the internet outage in Pakistan during the month of July-05 [pak-fibre] which disconnected the only submarine fibre link (SEAMEW3) for the whole nation of 150 Million for almost a fortnight. Officials of the Internet Service Provider Association of Pakistan (ISPAK) said “the entire country was facing an Internet blackout after a problem occurred at the end of the only Internet backbone provider – PTCL”. The backup satellite links were inadequate to handle the country’s internet traffic. As a result many sites had no international Internet access at all and the few lucky ones (priority was given to call centers) experienced high packet loss and unacceptable performance. There have been several such extended fibre outage incidents (March, June-July, September) in the last year.
Conclusions for
It appears that the NTC has an un-congested infrastructure and the minimum RTT from NTC to the PERN connected institutes is good. Adding another hop, the minimum RTT from NIIT being slightly higher is also understandable. However, the minimum RTT for the Micronet link suggests that the traffic, even if going to the same city adds around 45-50 ms to the RTT value as the service provider changes from NTC to Micronet. It also appears that the NIIT default link via NTC/PERN is heavily congested. Recent attempts to upgrade the link from 1 to 1.5Mbits/s have met with limited success.
International connectivity for
It is encouraging to know that NTC
and Micronet appear to provide good backbone Internet services in
Africa and
In Fig 15, the main influence on the min-RTT (blue bar) should be the
physical distance between the monitor and the monitored site. Min-RTTs of over
600ms usually indicate that a geo-stationary satellite link is in use. The
shortest min RTTs (the red ellipses) are expected to be between hosts that are
in the same country (e.g. an Indian host monitoring another Indian host). The
difference in the min-RTT and avg-RTT (the red bars) is an indication of
queuing delays or congestion.
It is seen that all sites monitored from
For within country paths between monitoring
and monitored sites,
Even though
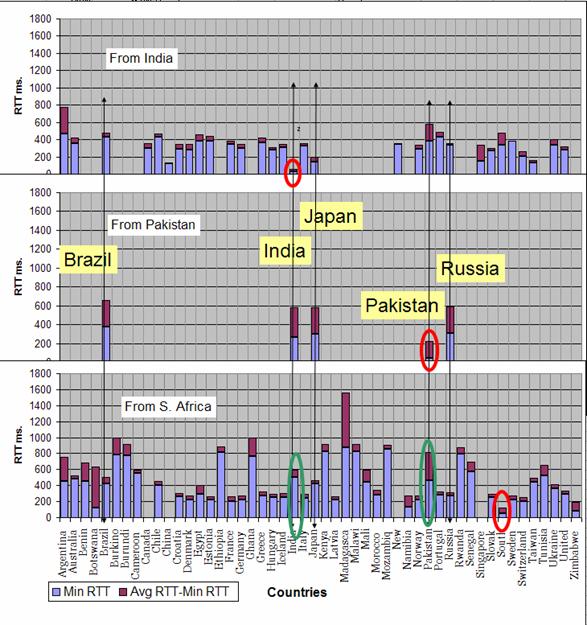
Figure 15: Congestion seen from Africa,
View from
Being behind the rest of the world, we feel
that
First
we looked at the traceroutes to these remote sites in African countries from
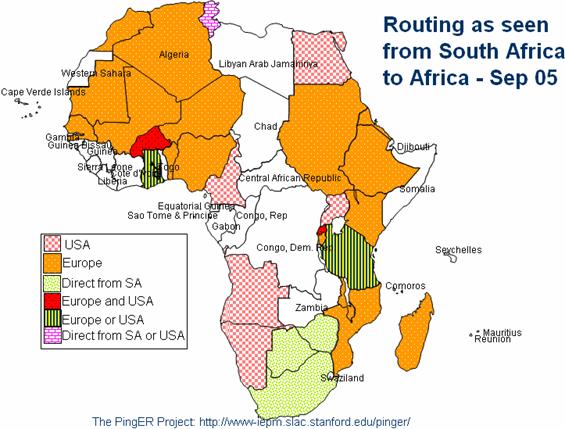
Figure
16: Routing to various countries in
The data is typically based on 2 or 3 nodes
per country. The initial analysis shows that the various countries in
Fig.
17 shows the losses from
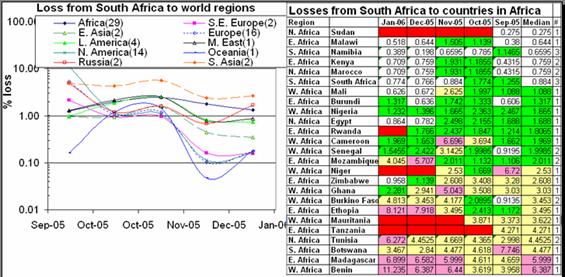
Figure 17: Losses from
Looking
at the losses from
IEPM-BW
Results
The PingER method of measuring throughput breaks down for high speed networks due to the different nature of packet loss for ping compared to TCP, and also since PingER only measures about 14,400 pings of a given size/month between a given monitoring host/monitored host pair. Thus if the link has a loss rate of better than 1/14400 the loss measurements will be inaccurate. For a 100Byte packet, this is equivalent to a Bit Error Rate (BER) of 1 in 108, and leading networks are typically better than this today (Jan 2006). For example if the loss probability is < 1/14400 then we take the loss as being 0.5 packet to avoid a division by zero, so if the average RTT for ESnet is 50msec then the maximum throughput we can use PingER data to predict is ~ 1460Bytes*8bits/(0.050sec*sqrt(0.5/14400)) or ~ 40Mbits/s and for an RTT of 200ms this reduces to 10Mbits/s.
To address this challenge and to understand and provide
monitoring of high performance throughput between major sites of interest to
HEP and the Grid, we developed the IEPM-BW monitoring infrastructure and
toolkit. There are about 5 major monitoring hosts and about 50 monitored hosts
in 9 countries (CA, CH, CZ, FR, IT, JP,
These measurements indicate that throughputs of several hundreds of Mbits/s are regularly achievable on today's production academic and research networks, using common off the shelf hardware, standard network drivers, TCP stacks etc., standard packet sizes etc. Achieving these levels of throughput requires care in choosing the right configuration parameters. These include large TCP buffers and windows, multiple parallel streams, sufficiently powerful cpus (typically better than 1 GHz), fast enough interfaces and busses, and a fast enough link (> 100Mbits/s) to the Internet. In addition for file operations one needs well designed/configured disk and file sub-systems.
Though not strictly monitoring, there is currently much activity in understanding and improving the TCP stacks (e.g. [floyd], [low], [ravot]). In particular with high speed links (> 500Mbits/s) and long RTTs (e.g. trans-continental or trans-oceanic) today's standard TCP stacks respond poorly to congestion (back off too quickly and recover too slowly). To partially overcome this one can use multiple streams or in a few special cases large (>> 1500Bytes) packets. In addition new applications ([bbcp], [bbftp], [gridftp]) are being developed to allow use of larger windows and multiple streams as well as non TCP strategies ([tsnami], [udt]). Also there is work to understand how to improve the operating system configurations [os] to improve the throughput performance. As it becomes increasingly possible to utilize more of the available bandwidth, more attention will need to be paid to fairness and the impact on other users (see for example [coccetti] and [bullot]). Besides ensuring the fairness of TCP itself, we may need to deploy and use quality of service techniques such as QBSS [qbss] or TCP stacks that back-off prematurely hence enabling others to utilize the available bandwidth better [kuzmanovic]. These subjects will be covered in more detail in the companion ICFA-SCIC Advanced Technologies Report. We note here that monitoring infrastructures such as IEPM-BW can be effectively used to measure and compare the performance of TCP stacks, measurement tools, applications and sub-components such as disk and file systems and operating systems in a real world environment.
New Monitoring and Diagnostic Efforts in HEP
PingER and IEPM-BW are excellent systems for monitoring the general health and capability of the existing networks used worldwide in HEP. However, we need additional end-to-end tools to provide individuals with the capability to quantify their network connectivity along specific paths in the network and also easier to use top level navigation/drill-down tools. The former are needed to both ascertain the user's current network capability as well as to identify limitations which may be impeding the user’s ultimate (expected) network performance. The latter are needed to simplify finding the relevant data.
Most HEP users are not "network wizards" and don't wish to become one. In fact as pointed out by Mathis and illustrated in Fig. 18, the gap in throughput between what a network wizard and a typical user can achieve is growing.
|
|
|
Figure 18: Bandwidth achievable by a network wizard and a typical user as a function of time. Also shown are some recent network throughput achievements in the HEP community. |
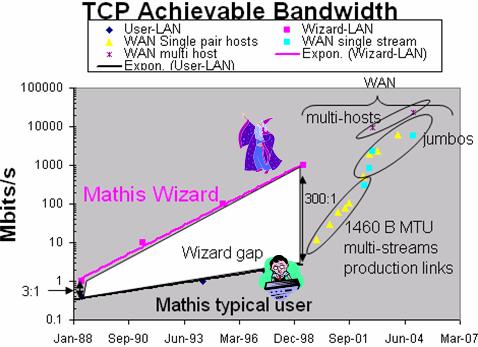
Because of HEP's critical dependence upon networks to enable their global collaborations and grid computing environments, it is extremely important that more user specific tools be developed to support these physicists.
Efforts are underway in the HEP community, in conjunction with the Internet2 End-to-End (E2E) Performance Initiative [E2Epi], to develop and deploy a network measurement and diagnostic infrastructure which includes end hosts as test points along end-to-end paths in the network. The E2E piPEs project [PiPES], the NLANR/DAST Advisor project [Advisor] and the EMA (End-host Monitoring Agent) [EMA] are all working together to help develop an infrastructure capable of making on demand or scheduled measurements along specific network paths and storing test results and host details for future reference in a common data architecture. The information format will utilize the GGF NMWG [NMWG] schema to provide portability for the results. This information could be immediately used to identify common problems and provide solutions as well as to acquire a body of results useful for baselining various combinations of hardware, firmware and software to define expectations for end users.
A primary goal is to provide as "lightweight" a client component as possible to enable widespread deployment of such a system. The EMA Java Web Start client is one example of such a client, and another is the Network Diagnostic Tester (NDT) tool [NDT]. By using Java and Java Web Start, the most current testing client can be provided to end users as easily as opening a web page. The current version supports both Linux and Windows clients.
Details of how the data is collected, stored, discovered
and queried are being worked out. A demonstration of a preliminary system is
being shown at the Internet2
Joint-techs meeting in
The goal of easier to use top level drill down navigation to the measurement data is being tackled by MonALISA [MonALISA] in collaboration with the IEPM project.
A long term goal is to merge Pinger and IEPM-BW results into a larger distributed database architecture for use by grid scheduling and network diagnostic systems. By combining general network health and performance measurement with specific end-to-end path measurements we can enable a much more robust, performant infrastructure to support HEP worldwide and help bridge the Digital Divide.
Recent studies of HEP needs, for example the TAN Report (http://gate.hep.anl.gov/lprice/TAN/Report/TAN-report-final.doc)
have focused on communications between developed regions such as
The PingER throughput predictions based on the Mathis formula assume that throughput is mainly limited by packet loss. The 40% per year growth curve in Fig. 10 is somewhat lower than the 79% per year growth in future needs that can be inferred from the tables in the TAN Report. True throughput measurements have not been in place for long enough to measure a growth trend. Nevertheless, the throughput measurements, and the trends in predicted throughput, indicate that current attention to HEP needs between developed regions could result in needs being met. In contrast, the measurements indicate that the throughput to less developed regions is likely to continue to be well below that needed for full participation in future experiments.
Comparisons
with Economic and Development Indicators
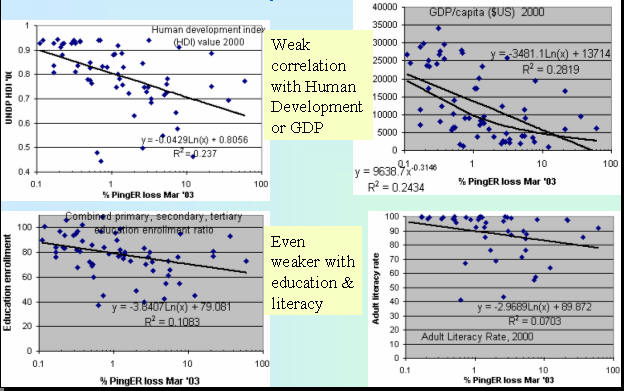
Various economic indicators have been developed by the U.N. and the International Telecommunications Union (ITU). It is interesting to see how well the PingER performance indicators correlate with the economic indicators. The comparisons are particularly interesting in cases where the agreement is poor, and may point to some interesting anomalies or suspect data.
The Human Development Index (HDI) is a summary measure of human development (see http://hdr.undp.org/reports/global/2002/en/ ). It measures the average achievements in a country in three basic dimensions of human development:
- A long and healthy life, as measured by life expectancy at birth
- Knowledge, as measured by the adult literacy rate (with two-thirds weight) and the combined primary, secondary and tertiary gross enrolment ratio (with one-third weight)
- A decent
standard of living, as measured by GDP per capita (PPP
|
|
|
Figure 19:
Comparisons of PingER losses seen from |
The Network Readiness Index (NRI) from the Center for
International Development,
|
|
|
Figure 20: PingER
throughputs measured from |
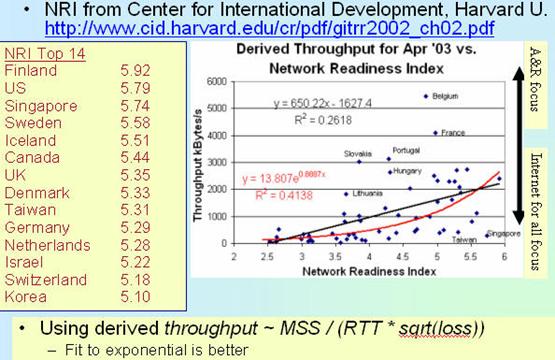
Some of the outlying countries are identified by name. Countries at the bottom right of the right hand graph may be concentrating on Internet access for all, while countries in the upper right may be focusing on excellent academic & research networks.
The Digital Access Index (DAI) created by the ITU combines eight variables, covering five areas, to provide an overall country score. The areas are availability of infrastructure, affordability of access, educational level, quality of ICT services, and Internet usage. The results of the Index point to potential stumbling blocks in ICT adoption and can help countries identify their relative strengths and weaknesses.
|
|
|
Figure 21: PingER
derived throughput vs. the ITU Digital Access Index for PingER countries
monitored from the |
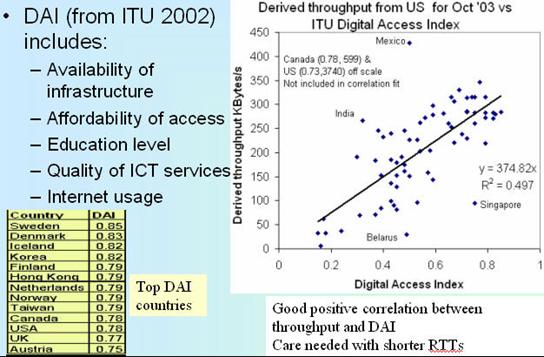
Since the PingER Derived Throughput is linearly proportional
to RTT, countries close to the
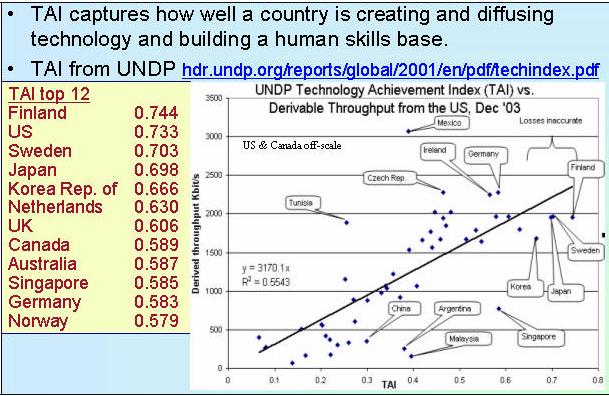
The United Nations Development Programme (UNDP) introduced
the Technology Achievement Index (TAI) to reflects a country's capacity to
participate in the technological innovations of the network age. The TAI aims to
capture how well a country is creating and diffusing technology and building a
human skill base. It includes the following dimensions: Creation of technology
(e.g. patents, royalty receipts); diffusion of recent innovations (Internet
hosts/capita, high & medium tech exports as share of all exports);
Diffusion of old innovations (log phones/capita, log of electric
consumption/capita); Human skills (mean years of schooling, gross enrollment in
tertiary level in science, math & engineering). Fig. 22 shows December
2003's derived throughput measured from the
|
|
|
Figure 22: PingER derived throughputs vs. the UNDP Technology Achievement Index (TAI) |
Accomplishments
since last report
We have extended the measurements to cover more developing countries and to increase the number of hosts monitored in each developing country. We have carefully evaluated the routes and minimum ping RTTs to verify that hosts are where they are identified to be in our database. As a result we have worked with contacts in relevant countries and sites to find alternatives, and about 20-30 hosts have been replaced by more appropriate hosts. In addition (see Table 6) we have added 14 new countries (AF, BJ, BU, CM, ET, GE, ML, PK, PA, PY, RW, SU, TH). At the same time we are no longer able to find hosts to monitor in 11 countries (AN, AU, BE, KY, MO, RE, SA,SC, SL, ES and VN). The unreachability of these sites has mainly been caused by ping blocking
The collaboration between SLAC and the NIIT in
We still spend much time working with contacts to unblock
pings to their sites (for example ~15% of hosts pingable in July 2003 were no
longer pingable in December 2003), to identify the locations of hosts and to
find new hosts/sites to monitor. It is unclear how cost-effective this activity
is. It can take many emails to explain the situation, sometimes requiring
restarting when the problem is passed to a more technically knowledgeable
person. Even then there are several unsuccessful cases where even after many
months of emails and the best of intentions the pings remain blocked. One
specific case was for all university sites in
Even finding knowledgeable contacts, explaining what is needed and following up to see if the recommended hosts are pingable, is quite labor intensive. To assist with this we have created a brochure for PingER describing its purposes, goals and requirements. More recently we have had some success by using Google to search for university web sites in specific TLDs. The downside is that this way we do not have any contacts with specific people with whom we can deal in case of problems.
Efforts to Improve PingER Management:
With the increase in the monitoring data of PingER,
we initiated efforts to develop supporting systems for better management and
installation of PingER. In all, three major initiatives have been taken, which
are summarized below:
TULIP- IP Locator Using Triangulation
With the growth in the coverage of PingER arises the
great difficulty of keeping track of the changes in the physical
locations of the monitored sites. This might lead to mis-leading conclusions,
for instance our sole monitoring node in
The location of an IP address is being determined using the minimum RTT measured from multiple “landmark” sites at known locations, and triangulating the results to obtain an approximate location. The basic application, prototype deployed at http://www.slac.stanford.edu/comp/net/wan-mon/tulip/ is a java based jnlp application that takes RTT measurements from landmarks to a selected target host (typically at an unknown location) specified by the user and figures out the latitudes and longitudes of the target host. The application is under-development and its algorithm and the provision of landmark sites under constant improvement to make the process reasonably accurate.
TULIP (IP Locator
Using Triangulation) will also utilize the historical min-RTT PingER data in
order to verify the locations of hosts/sites recorded in the PingER
configuration database, and to optimize the choices of parameters used by
TULIP.
The
PingER Management Initiative
Since its inception, the size of the PingER project has grown to where it is now monitoring hosts in over 120 countries from about 35 monitoring hosts in 14 countries. With growth in the number of monitoring as well as monitored (remote) nodes, it was perceived that automated mechanisms need to be developed for managing this project. The following modules for PingER management project are being developed or under testing:
·
Creation of filters to indicate the monitoring
sites whose data is not available
· Creation of filters to indicate the monitored sites that are not available and categorize them according to their response status.
· Identification of a host that physically moves to a new location (e.g. a named web server actually is a proxy that is not where it used to be), by calculating drastic changes in the minimum RTTs of the monitored hosts
· Automated report generation tool to generate daily, monthly, yearly reports regarding problems in monitored data.
· Detect sudden, significant (anomalous) changes in the behavior (including breaks in reachability) of the network.
· Identifying discrepancies (e.g. impossible values) in measured data and in the host configuration databases (e.g. at the time of registration of the monitored hosts, the data entered might be incorrect and incomplete).
PingER2: Easy InstallationUntil last year, PingER had a complex installation procedure. An initial improved installation process was developed by students working under Warren Matthews at Georgia Tech. This was extended, and productized by two NIIT project students in order to integrate the improvements and make PingER easier to install for the monitoring sites. This upgrade was necessary, given the increase in the number of monitoring sites around the globe, and the lack of technical skills at the newer sites, especially in the developing regions. The new version is called PingER2, which possesses the same functionality as PingER, but is much easier to install. As a result, the new monitoring hosts in Africa and Pakistan
Publications/Presentations:
- Bringing the
Internet to China Essay by Les Cottrell in Symmetry magazine
volume 02, issue 09, November 05.
- PingER
Brochure
- Report
from ICFA Digital Divide WorkshopCommand: Daegu, Korea, May 23-27 05
presented by Les Cottrell at the Internet2 Fall Members meeting,
- Network
Monitoring for SCIC prepared by Les Cottrell for the ICFA meeting
September 2005.
- Network
Monitoring Tools for High Performance Networks presented by Les
Cottrell at the Internet Fall 2005 Members meeting,
- Network
Monitoring for ICFA/SCIC presented by Les Cottrell, at ICFA/SCIC
meeting 8/24/05
- Monitoring
10Gbits/s and Beyond presented by Les Cottrell at the LHC tier0,
tier1 meeting, CERN Jily 19 '05
- Forecasting
Network Perfomance presented by Les Cottrell at the Grid
Performance Workshop, Edinburgh June 2005.
- Diagnostic
Steps presented by Les Cottrell at the Networking for
Non-Networkers second Workshop in
- Quantifying
the Digital Divide from Within and Without presented by Les
Cottrell at the International ICFA Workshop on HEP Networking, Grid and
Digital Divide Issues for Global e-Science, Daegu, Korea, May 23-27, 2005.
- Internet
Monitoring and Tools presented by Les Cottrell at the
International ICFA Workshop on HEP Networking, Grid and Digital Divide
Issues for Global e-Science, Daegu, Korea, May 23-27, 2005.
- Quantifying
the Digital Divide from Within and Without presented by Les
Cottrell at the Internet2 Members Meeting SIG on Hard to Reach Network
Places,
- Datagrid
Wide Area Monitoring Infrastructure (DWMI) aka IEPM-BW presented
by Connie Logg to the ESCC and the Joint Techs Performance Tools Workshop,
February 2005.
- End-to-end
Anomalous Event Detection in Production Networks, presented by Les
Cottrell at the ESnet Site Coordinators metting, Salt Lake City, February
2005.
- Quantifying
the Digital Divide, prepared by Les Cottrell for the
Internet2/World Bank meeting, Feb 7 2005.
There is interest from ICFA, ICTP and others to extend the
monitoring further to countries with no formal HEP programs, but where there
are needs to understand the Internet connectivity performance in order to aid
the development of science.
Extend the monitoring from within developing countries to provide performance within developing regions, between developing regions and from developing regions to developed regions.
We should ensure there are >=2 remote sites monitored in each Developing Country. All results should continue to be made available publicly via the web, and publicized to the HEP community and others. Typically HEP leads other sciences in its needs and developing an understanding and solutions. The outreach from HEP to other sciences is to be encouraged. The results should continue to be publicized widely.
We need assistance from ICFA and others to find sites to monitor and contacts in the following countries:
- Latin
America:
- Belarush
(need > 1),
- Africa: Algeria, Benin, Burundi, Cameroon, Ethiopia, Ghana, Mali, Madagascar, Mauritania, Niger, Somalia, Sudan, Zimbabwe (all need > 1 site/country), Libya, (have none)
- Mid East
and Central Asia:
Continue work on reducing the ongoing management and improving the quality of the data:
- simplify and where possible automate the procedures to analyze and create the summary statistical information (graphs and tables seen in the current report) at regular intervals;
- develop automated methods to discover non-responsive hosts, make extra tests to pin-point reasons for non-responsiveness, and report to administrator together with contact email addresses.
Although not a recommendation per se, it would be
disingenous to finish without noting the following. SLAC & FNAL are the
leaders in the PingER project. The funding for the PingER effort came from the
DoE MICS
Appendix:
Countries in PingER Database
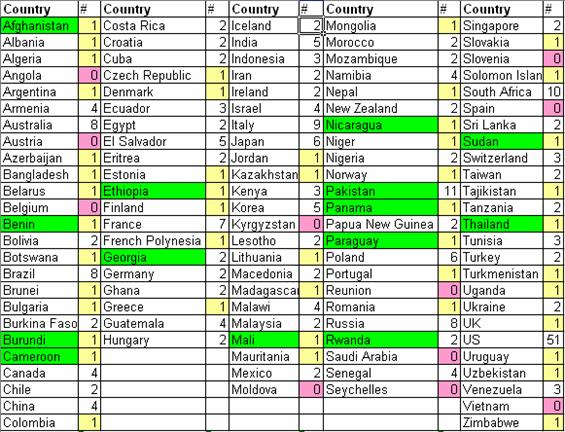
Table 6 lists the 115 countries
currently (January 1st 2005) in the PingER database. Such countries
contain zero (the
Table 6: PingER countries monitored from SLAC with the number of
sites/country. Countries in green were added in 2005. We are unable to find any
monitorable sites any longer in countries with 0 sites.
[Advisor] http://dast.nlanr.net/Projects/Advisor/
[
[africa-rtm] Enrique Canessa, "Real time network monitoring in
[bbcp] Andrew Hanushevsky, Artem Trunov, and Les Cottrell, "P2P Data Copy
Program bbcp", CHEP01, Beijing 2002. Available at
http://www.slac.stanford.edu/~abh/CHEP2001/p2p_bbcp.htm
[bbftp] "Bbftp". Available http://doc.in2p3.fr/bbftp/.
[bcr] “Application Demands Outrun Internet Improvements”, P. Sevcik, Business
Communications Review, January 2006.
[bullot] "TCP Stacks Testbed", Hadrien Bullot and
R. Les Cottrell. Avialble at http://www-iepm.slac.stanford.edu/bw/tcp-eval/
[cia-pop-figures] Available at: http://www.cia.gov/cia/publications/factbook/fields/2119.html
[coccetti] "TCP STacks on Production Links",
Fabrizzio Coccetti and R. Les Cottrell. Available at http://www-iepm.slac.stanford.edu/monitoring/bulk/tcpstacks/
[E2Epi] http://e2epi.internet2.edu/
[eassy] The East African Submarine System http://eassy.org/
[ejds-email] Hilda Cerdeira and the eJDS Team, ICTP/TWAS
Donation Programme, "Internet Monitoring of Universities and
[ejds-africa] "Internet Performance to Africa" R. Les Cottrell and
Enrique Canessa, Developing Countries Access to Scientific Knowledge:
Quantifying the Digital Divide, ICTP Trieste, October 2003; also
SLAC-PUB-10188. Available http://www.ejds.org/meeting2003/ictp/papers/Cottrell-Canessa.pdf
[ejds-pinger] "PingER History and Methodology", R. Les Cottrell,
Connie Logg and Jerrod Williams. Developing Countries Access to Scientific
Knowledge: Quantifying the Digital Divide, ICTP Trieste, October 2003; also
SLAC-PUB-10187. Available http://www.ejds.org/meeting2003/ictp/papers/Cottrell-Logg.pdf
[EMA] http://monalisa.cern.ch/EMA/
[floyd] S. Floyd, "HighSpeed TCP for Large Congestion Windows",
Internet draft draft-floyd-tcp-highspeed-01.txt, work in progress, 2002.
Available http://www.icir.org/floyd/hstcp.html
[gridftp] "The GridFTP Protocol Protocol and Software". Available http://www.globus.org/datagrid/gridftp.html
[host-req] "Requirements for WAN Hosts being Monitored", Les Cottrell
and Tom Glanzman. Available at http://www.slac.stanford.edu/comp/net/wan-req.html
[icfa-98] "May 1998 Report of the ICFA NTF Monitoring Working Group".
Available http://www.slac.stanford.edu/xorg/icfa/ntf/
[icfa-mar02] "ICFA/SCIC meeting at CERN in March 2002". Available
http://www.slac.stanford.edu/grp/scs/trip/cottrell-icfa-mar02.html
[icfa-jan03] "January 2003 Report of the ICFA-SCIC Monitoring Working Group".
Available http://www.slac.stanford.edu/xorg/icfa/icfa-net-paper-dec02/
[icfa-jan04] "January 2004 Report of the ICFA-SCIC
Monitoring Working Group". Available http://www.slac.stanford.edu/xorg/icfa/icfa-net-paper-jan04/
[iepm] "Internet End-to-end Performance Monitoring - Bandwidth to the
World Project". Available http://www-iepm.slac.stanford.edu/bw
[ictp] Developing
Country Access to On-Line Scientific Publishing: Sustainable Alternatives,
Round Table meeting held at ICTP
[ictp-jensen] Mike Jensen, "Connectivity
Mapping in Africa", presentation at the ICTP Round Table on Developing
Country Access to On-Line Scientific Publishing: Sustainable Alternatives at
ITCP,
[ictp-rec] RECOMMDENDATIONS
OF the Round Table held in Trieste to help bridge the digital divide.
Available http://www.ictp.trieste.it/ejournals/meeting2002/Recommen_Trieste.pdf
[kuzmanovic] "HSTCP-LP: A Protocol for Low-Priority Bulk Data Transfer in
High-Speed High-RTT Networks", Alexander Kuzmanovic, Edward Knightly and
R. Les Cottrell. Available at http://dsd.lbl.gov/DIDC/PFLDnet2004/papers/Kuzmanovic.pdf
[low] S. Low, "Duality model of TCP/AQM + Stabilized Vegas".
Available http://netlab.caltech.edu/FAST/meetings/2002july/fast020702.ppt
[mathis] M. Mathis, J. Semke, J. Mahdavi, T. Ott, "The
Macroscopic Behavior of the TCP Congestion Avoidance Algorithm",Computer
Communication Review, volume 27, number 3, pp. 67-82, July 1997
[MonALISA] http://monalisa.cacr.caltech.edu/
[NDT] http://miranda.ctd.anl.gov:7123/
[NMWG] http://www-didc.lbl.gov/NMWG/
[nua] NUA Internet Surveys, "How
many Online". Available http://www.nua.ie/surveys/how_many_online/
[os] "TCP Tuning Guide". Available
http://www-didc.lbl.gov/TCP-tuning/
[pak-develop-news] News Article entitled “PM launches Seamewe-4 submarine cable”
Available at http://www.jang.com.pk/thenews/jan2006-daily/03-01-2006/main/main5.htm
[pak-fibre] “Fiber Outage in
[pinger] "PingER". Available http://www-iepm.slac.stanford.edu/pinger/; W. Matthews and R. L. Cottrell, "The PingER Project: Active Internet Performance Monitoring for the HEP Community", IEEE Communications Magazine Vol. 38 No. 5 pp 130-136, May 2002.
[Pernprop] PC-1 Documents: 1) “Last Mile Pakistan Education and Research Network Connectivity Model PC-1” and 2 ) “Conversion of last mile Pakistan Education and Research Network Connectivity to Fiber Optics Model” PC-1 Available at: http://www.pern.edu.pk/PC-1doc/pc-1doc.html
[pinger-deploy] "PingER Deployment". Available http://www.slac.stanford.edu/comp/net/wan-mon/deploy.html
[PiPES] http://e2epi.internet2.edu/
[qbss] "SLAC QBSS Measurements". Available
http://www-iepm.slac.stanford.edu/monitoring/qbss/measure.html
[ravot] J. P. Martin-Flatin and S. Ravot, "TCP Congestion Control in Fast
Long-Distance Networks", Technical Report CALT-68-2398, California
Institute of Technology, July 2002. Available
http://netlab.caltech.edu/FAST/publications/caltech-tr-68-2398.pdf
[tsunami] "Tsunami". Available
http://ncne.nlanr.net/training/techs/2002/0728/presentations/pptfiles/200207-wallace1.ppt
[tutorial] R. L. Cottrell, "Tutorial on Internet Monitoring & PingER
at SLAC". Available http://www.slac.stanford.edu/comp/net/wan-mon/tutorial.html
[udt] Y Gu, R. L Grossman, “UDT: An Application Level Transport Protocol for
Grid Computing”, submitted to the Second International Workshop on Protocols
for Fast Long-Distance Networks.
[un] "United Nations Population Division World Population Prospects Population database". Available http://esa.un.org/unpp/definition.html
1.
In special cases, there is an option to reduce the network impact to ~ 10bits/s
per monitor-remote host pair.
2. Since North America officially includes
h. These countries appear in the Particle Data Group diary and so would appear
to have HEP programs.
*. These countries are no longer monitored, uually the host no longer exists,
or pings are blocked.