This web page contains the averages of the ratios of Branching Fractions
R(D*)=BF(B→D*τντ)/BF(B→D* l νl)
and R(D)=BF(B→Dτντ)/BF(B→D l νl).
In the present average we consider the following measurements:
| Experiment | R(D*) | R(D) | Rescaled Correlation (stat/syst/total) | Parameters | Remarks |
|---|---|---|---|---|---|
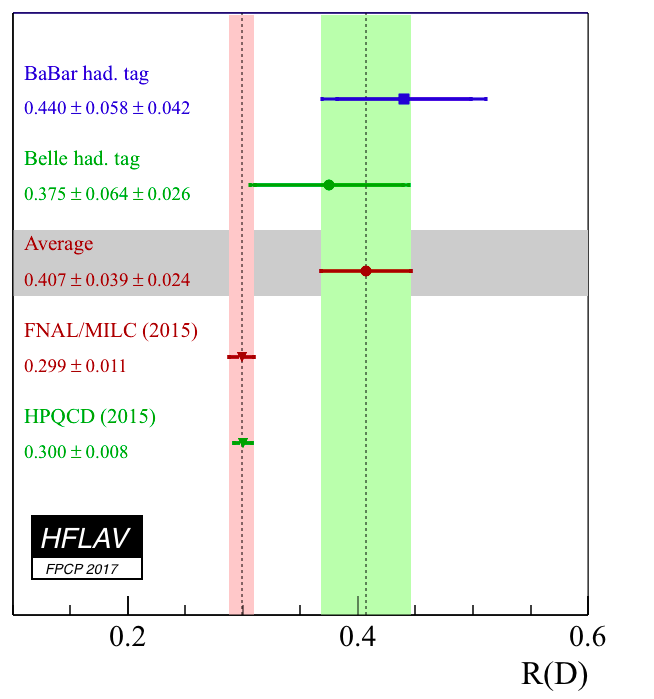
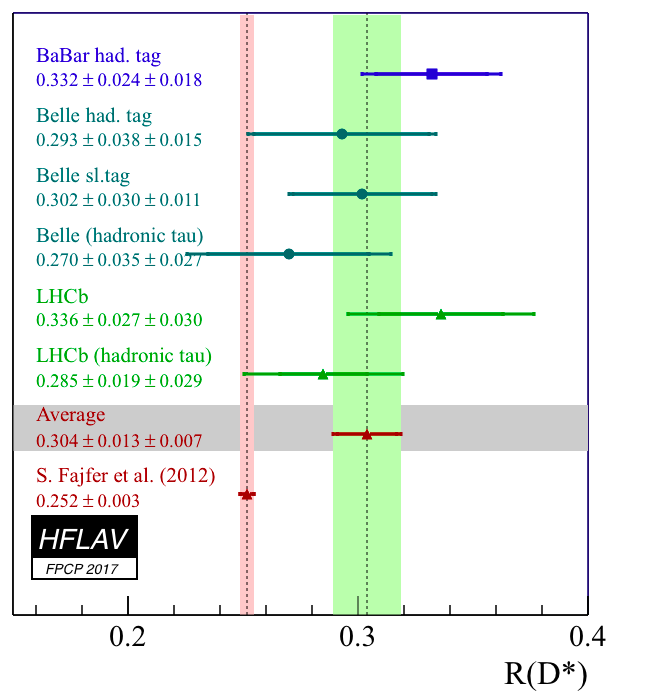
| BaBar | 0.332 +/- 0.024+/- 0.018 | 0.440 +/- 0.058 +/- 0.042 | -0.45/-0.07/-0.27 | input | Phys.Rev.Lett. 109,101802 (2012) [arXiv:1205.5442 [hep-ex]] Phys.Rev.D 88, 072012 (2013) [arXiv:1303.0571] |
| BELLE | 0.293 +/- 0.038 +/- 0.015 | 0.375 +/- 0.064 +/- 0.026 | -0.56/-0.11/-0.49 | input | Phys.Rev.D 92, 072014 (2015) [arXiv:1507.03233 [hep-ex]] |
| BELLE | 0.302 +/- 0.030 +/- 0.011 | - | - | input | Phys.Rev. D94,072007 (2016) [arXiv:1607.07923 [hep-ex]] |
| LHCb | 0.336 +/- 0.027 +/- 0.030 | - | - | input | Phys.Rev.Lett.115,111803 (2015) [arXiv:1506.08614 [hep-ex]] |
| BELLE | 0.270 +/- 0.035 + 0.028-0.025 | - | - | input | Phys.Rev.Lett.118,211801 (2017) [arXiv:1612.00529 [hep-ex]] |
| LHCb | 0.285 +/- 0.019 +/- 0.029 | - | - | input | Presented at FPCP2017 [Slides] |
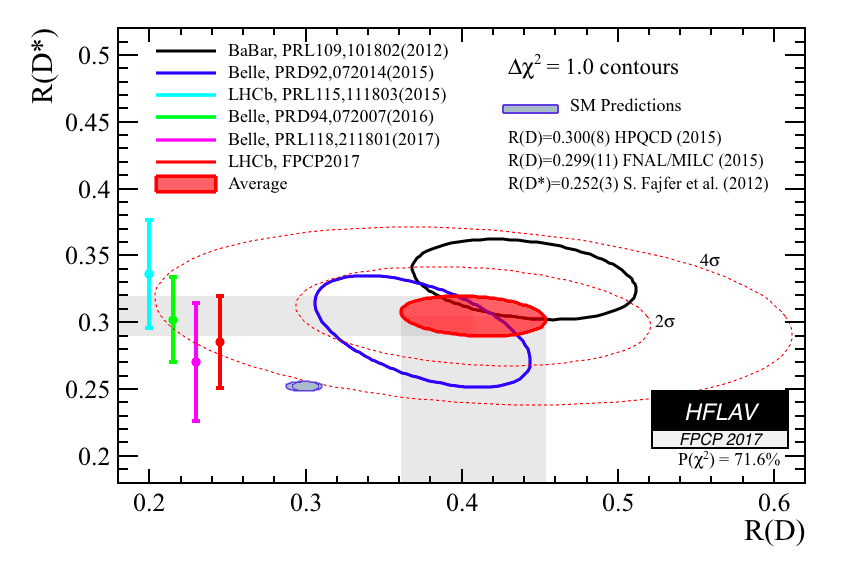
| Average | 0.304 +/- 0.013 +/- 0.007 | 0.407 +/- 0.039 +/- 0.024 | -0.20 | chi2/dof = 3.71/6 (CL = 0.716) |
R(D)-R(D*).pdf
.png
.C (dashed curves correspond to 2 and 4 σ contours) R(D) .pdf .png .C R(D*) .pdf .png .C |
SM predictions for R(D) based on recent Lattice calculations:
The most recent SM prediction for R(D*):
R(D) and R(D*) exceed the SM predictions by 2.3σ and 3.4σ respectively (comparing R(D) with FLAG average). Considering the R(D)-R(D*) correlation of -0.20, the resulting combined χ2 is 20.60 for 2 degree of freedom, corresponding to a p-value of 4.13 x 10⁻⁵. The difference with the SM predictions reported above, corresponds to about 4.1σ.