World Average Value for the Ds+ Decay Constant fDs
(updated 20 January 2011)

People working on this:   David Asner, David Cassel, Jonathan Coleman, Brian Meadows, Alan Schwartz


Input results for B(Ds+ → μ+ ν) and B(Ds+ → τ+ ν):

Entry Year Experiment Source Mode Branching Fraction
1 2010 BaBar P. del Amo Sanchez et al. (BaBar Collab.), Phys. Rev. D 82, 091103(R) (2010). μ+ ν (6.02 ± 0.38 ± 0.34) × 10-3
2 2009 CLEO-c J. P. Alexander et al. (CLEO Collab.), Phys. Rev. D 79, 052001 (2009). μ+ ν (5.65 ± 0.45 ± 0.17) × 10-3
3 2008 Belle L. Widhalm et al. (Belle Collab.), Phys. Rev.Lett. 100, 241801 (2008). μ+ ν (6.44 ± 0.76 ± 0.52) × 10-3
4 2007 CLEO-c M. Artuso et al., (CLEO Collab.), Phys. Rev.Lett. 99, 071802 (2007). μ+ ν (5.94 ± 0.66 ± 0.31) × 10-3
5 2007 Babar B. Aubert et al., (BABAR Collab.), Phys. Lett. 98, 141801 (2007) μ+ ν / φ π+ (6.74 ±0.83 ± 0.26 ±0.66 ) × 10-3
6 2002 ALEPH A. Heister et al., (ALEPHCollab.), Phys. Lett. B528, 1 (2002). μ+ ν / φ π+ (6.8 ± 1.1 ± 1.8) × 10-3
7 2000 BEATRICE Y.Alexandrov et al., (BEATRICE Collab.), Phys. Lett. B478, 31 (2000).  μ+ ν / φ π+ (8.3 ± 2.3 ± 0.6 ± 2.1 ) × 10-3
8 1998 CLEO M. Chadha et al., (CLEO Collab), Phys. Rev. D58, 032002(1998).  μ+ ν / φ π+ (6.2 ± 0.8 ± 1.3 ± 1.6) × 10-3
9 2010 BaBar J. P. Lees et al. (BaBar Collab.), arXiv:1003.3063 τ+ ν / K0S K+
+ → e+ ν ν)
(4.5 ± 0.5 ± 0.4± 0.3) %
10 2010 BaBar P. del Amo Sanchez et al. (BaBar Collab.), Phys. Rev. D 82, 091103(R) (2010). τ+ ν
+ → e+ ν ν)
(5.07 ± 0.52 ± 0.68) %
11 2010 BaBar P. del Amo Sanchez et al. (BaBar Collab.), Phys. Rev. D 82, 091103(R) (2010). τ+ ν
+ → μ+ ν ν)
(4.91 ± 0.47 ± 0.54) %
12 2009 CLEO-c P. Naik et al. (CLEO Collab.), Phys. Rev. D 80, 112004 (2009). τ+ ν
+ → ρ+ ν)
(5.52 ± 0.57 ± 0.21) %
13 2009 CLEO-c P. U. E. Onyisi et al. (CLEO Collab.), Phys. Rev. D 79, 052002 (2009). τ+ ν
+ → e+ ν ν)
(5.30 ± 0.47 ± 0.22) %
14 2009 CLEO-c J. P. Alexander et al. (CLEO Collab.), Phys. Rev. D 79, 052001 (2009). τ+ ν
+ → π+ ν)
(6.42 ± 0.81 ± 0.18) %
15 2008 CLEO-c K.M. Ecklund et al. (CLEO Collab.), Phys. Rev. Lett. 100, 161801 (2008). τ+ ν (6.17 ± 0.71 ± 0.36) %
16 2007 CLEO-c M. Artuso et al., (CLEO Collab.), Phys. Rev. Lett. 99, 071802 (2007). τ+ ν (8.0 ± 1.3 ± 0.4) %
17 2002 ALEPH A. Heister et al., (ALEPHCollab.), Phys. Lett. B528, 1 (2002). τ+ ν (5.8 ± 0.8 ± 1.8) %
18 2001 OPAL G. Abbiendi et al., (OPAL Collan.), Phys. Lett. B516, 236 (2001). τ+ ν (7.0 ± 2.1 ± 2.0) %
19 1997 L3 M. Acciarri et al., (L3 Collab.), Phys. Lett. B396, 327 (1997) τ+ ν (7.4 ± 2.8 ± 1.6 ± 1.8) %


Procedure:
HFAG uses Belle, BaBar, and CLEO measurements of B(Ds+ → μ+ ν) and B(Ds+ → τ+ ν) to calculate a world average (WA) value for fDs.
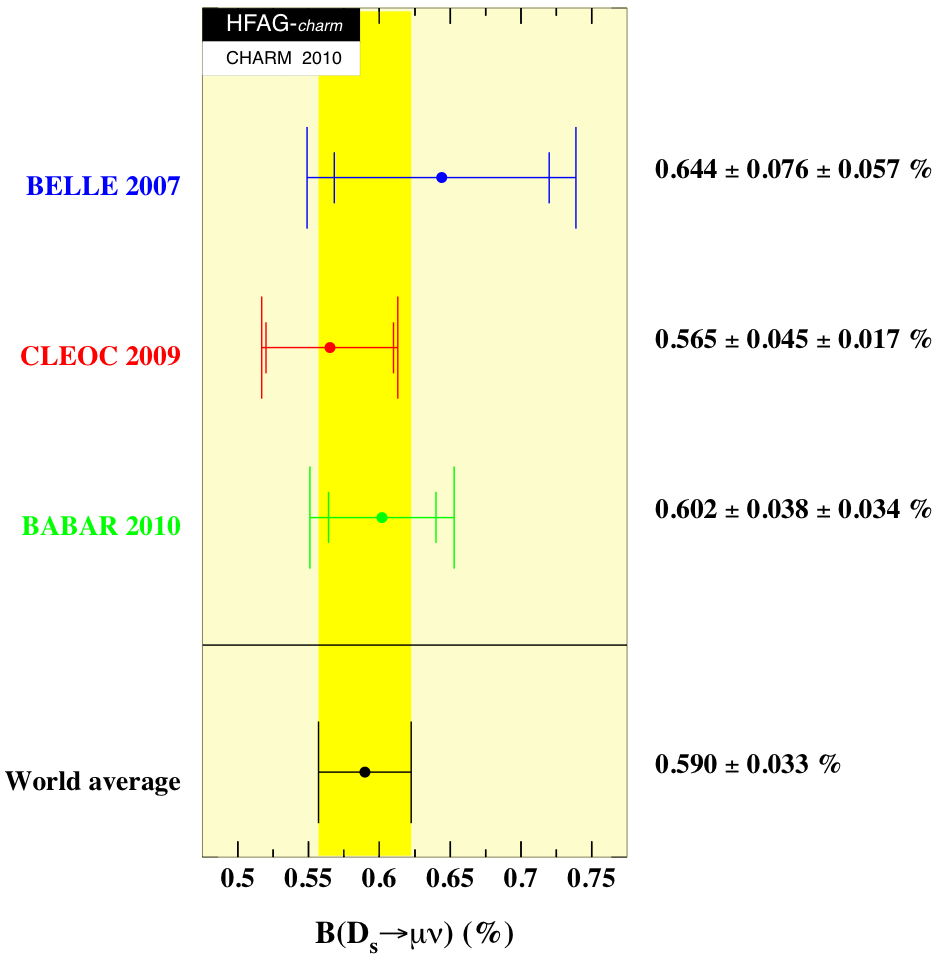
 The B(Ds+ → μ+ ν) results used are entries #1-3 in the table above;
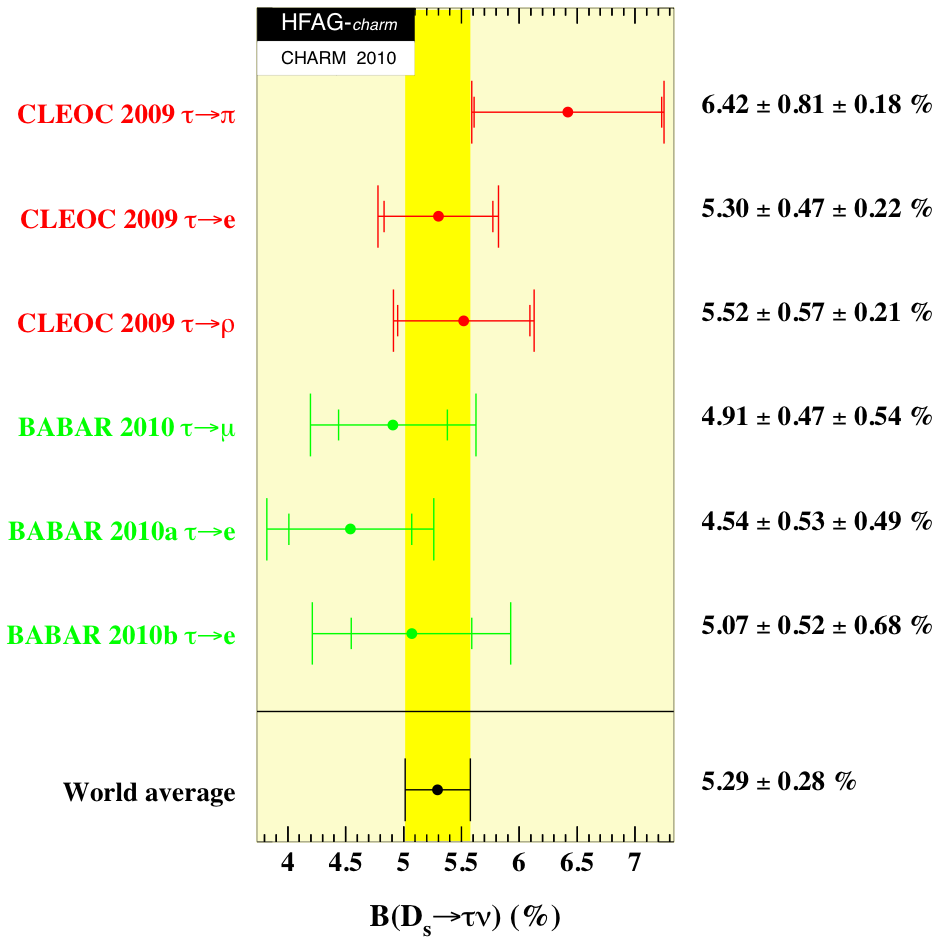
 the B(Ds+ → τ+ ν) results used are entries #9-14. Other entries in the table are not used due to either (a) their being superseded; (b) their having additional unpublished uncertainties; or (c) their having limited precision. Note that BaBar entry #1 (2010) supersedes BaBar entry #5 (2007). BaBar entries #9 (2010) and #10 (2010) have a 40% statistical correlation. These latter entries (#9, #10) and CLEO-c entry #13 (2009) have an 0.28% systematic correlation due to the branching fraction B(τ → e νe ντ ) = (17.85 ± 0.05)%.


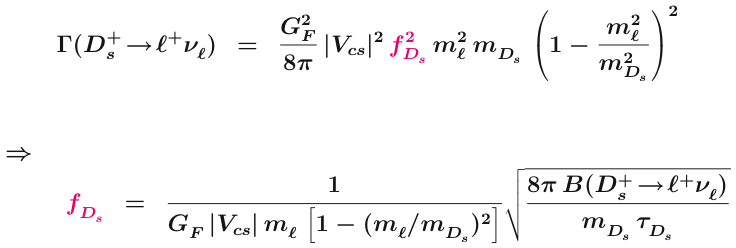
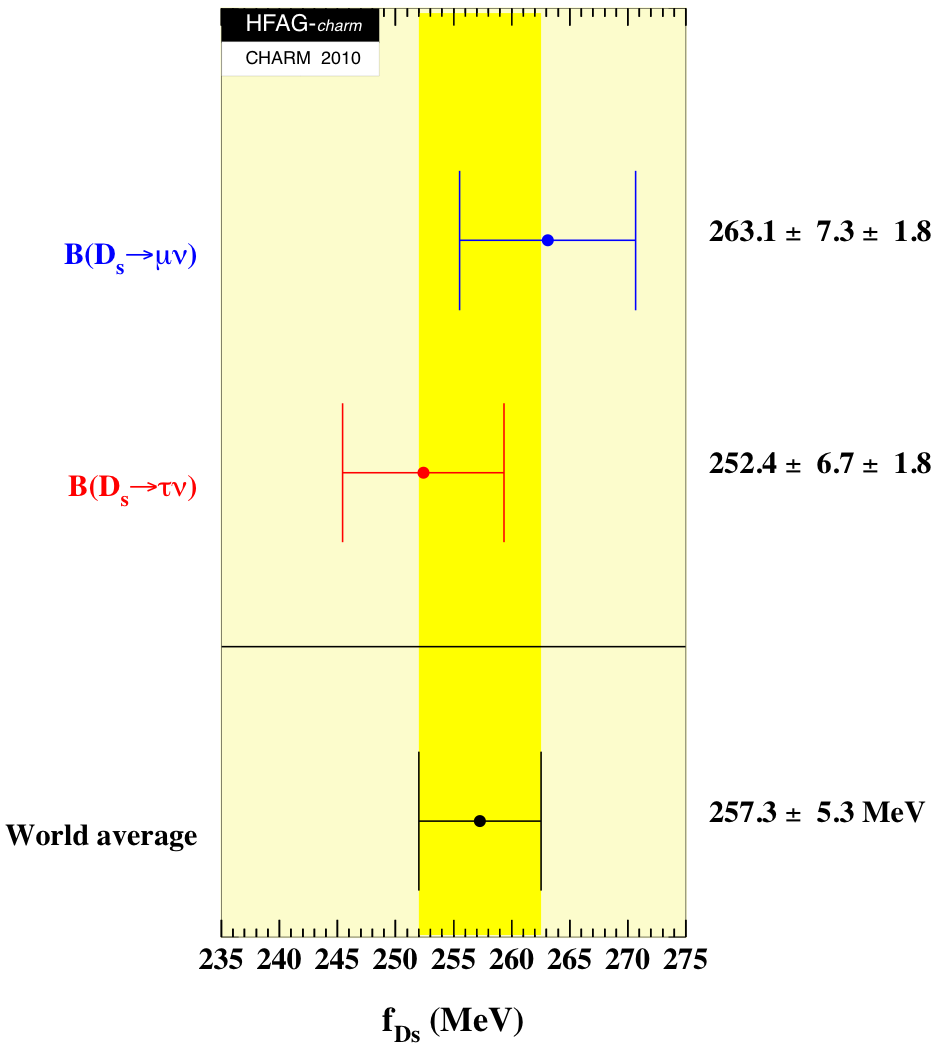
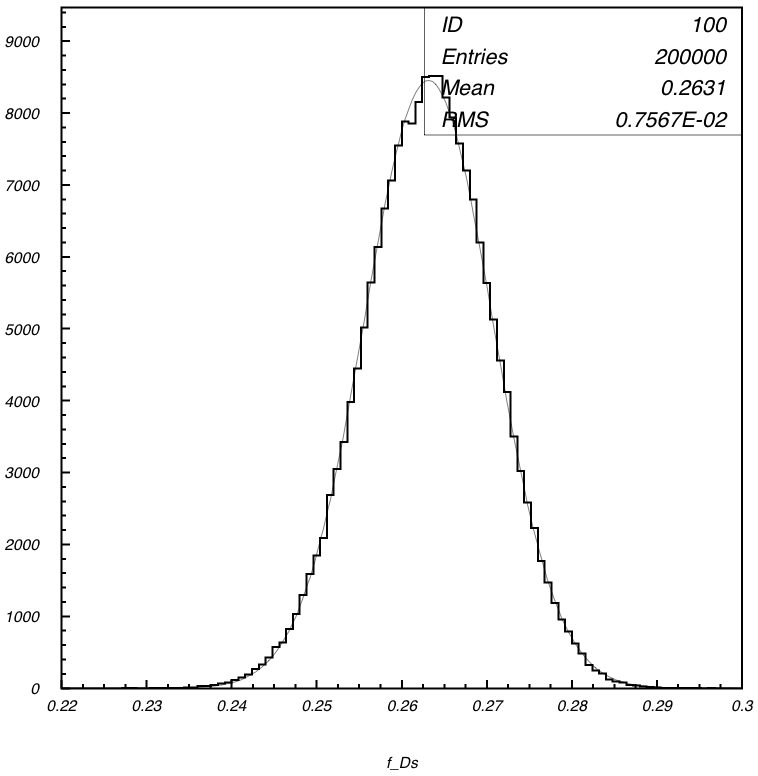
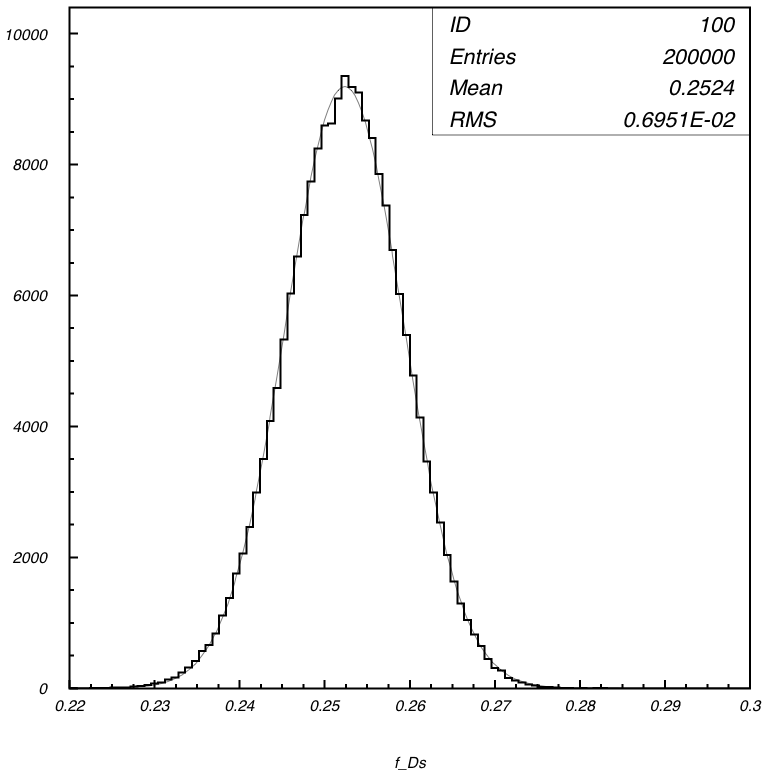
As a first step we calculate WA values for B(Ds+ → μ+ ν) [plot A] and B(Ds+ → τ+ ν) [plot B] . We then use these WA values to find values for fDs via the equation below, where l = μ or τ. The resulting values fDs(μ) and fDs(τ) are subsequently combined by taking a weighted average, accounting for correlations due to MDs, τDs, and Vcs [plot C] . The errors on fDs(μ) and fDs(τ) are calculated as follows: values for parameters on the right-hand-side of the equation below are sampled from gaussian distributions having mean values equal to the central values and standard deviations equal to the respective errors. The resulting values of fDs are plotted [plots D, E] , and the r.m.s. of the distribution is taken as the ± 1σ error.


Results [plot C] :
(click on figure for higher resolution)

Note that the first error listed is the total uncorrelated error (statistical plus systematic), and the second error listed is the correlated error (mainly from τDs). The COMBOS output is here .


The World Average is:     f Ds = (257.3 ± 5.3) MeV


      B(Ds+ → μ+ ν) average [plot A] :                                           B(Ds+ → τ+ ν) average [plot B] :
      (click on figure for higher resolution)                                                                     (click on figure for higher resolution)
      The COMBOS output is here.                                                                                 The COMBOS output is here.


      fDs from B(Ds+ → μ+ ν) [plot D] :                                         fDs from B(Ds+ → τ+ ν) [plot E] :
      (sampling over parameters and their uncertainties)                                                 (sampling over parameters and their uncertainties)


      Parameter values as taken from the 2010 Particle Data Book:
            GF /(ℏc)3 = (1.16637 ± 0.00001) × 10-5 GeV-2
            Mμ = 0.105658367 GeV/c2
            Mτ = (1.77682 ± 0.00016) GeV/c2
            MDs = (1.96847 ± 0.00033) GeV/c2
            Vcs = 0.97345 +0.00015-0.00016
            τDs = (500 ± 7) × 10-15 s


This page is maintained by A. Schwartz and was last updated