| full size PNG | PDF format |
| |
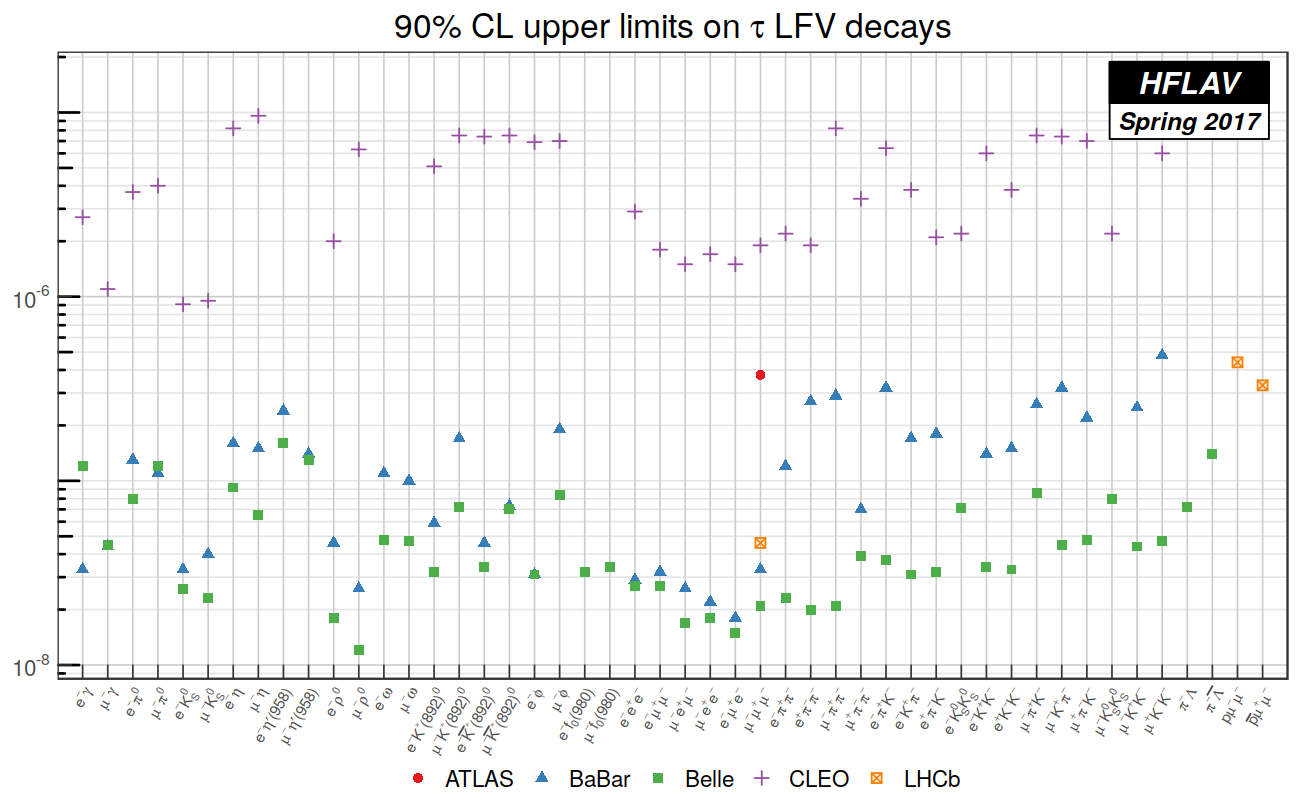
| Figure 2: Tau lepton-flavor-violating branching fraction upper limits summary plot. In order to appreciate the physics reach improvement over time, the plot includes also the CLEO upper limits reported by PDG 2016 [2]. |
full size PNG PDF format
Figure 2: Tau lepton-flavor-violating branching fraction upper limits summary plot. In order to appreciate the physics reach improvement over time, the plot includes also the CLEO upper limits reported by PDG 2016 [2].