Slide 26 of 30
Notes:
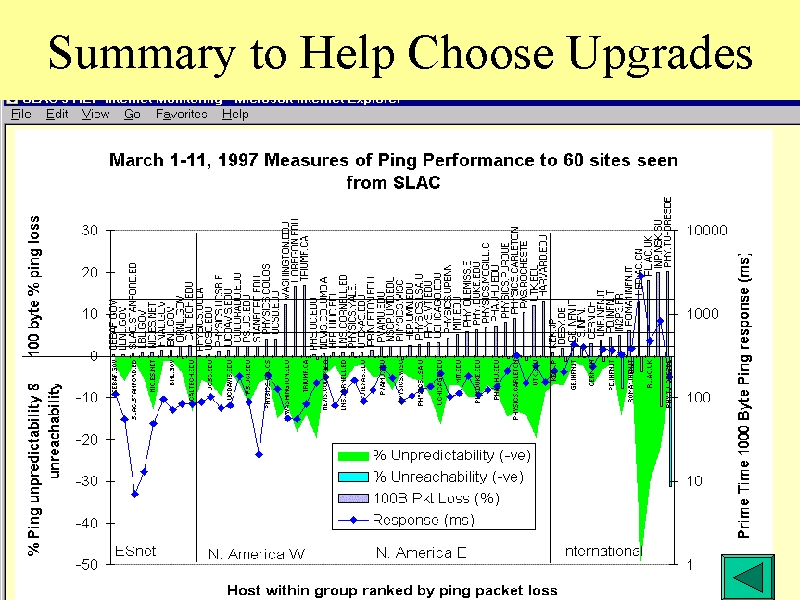
In the above plot, the loss and response time are measured during SLAC prime time (7am - 7pm, weekdays), the other measures are for all the time.
The hosts are grouped according to how they are connected to SLAC and the geographical location of the site.
Within the groups the hosts are ranked by packet loss.
•The loss rates are plotted as a bar graph above the y=0 axis and are for 100 byte payload ping packets. Horizontal lines are indicated at packet losses of 1%, 5% and 12% at the boundaries of the connection qualities defined above.
•The response time is plotted as a blue line on a log axis, labelled to the right, and is the round trip time for 1000 byte ping payload packets.
•The host unreachability is plotted as a bar graph negatively extending from the y=0 axis.
A host is deemed unreachable at a 30 minute interval if it did not respond to any of the
21 pings made at that 30 minute interval.
•The host unpredictability is plotted in green here as a negative value, can range from 0 (totally unpredictable) to 1 (highly predictable) and is a measure of the variability of the ping response time and loss during each 24 hour day.
•ESnet hosts in general have good packet loss (median 0.79%).
The average packet losses for the other groups varies from about 4.5% (N. America East) to 7.7% (International).
Typically 25%-35% of the hosts in the non-ESnet groups are in the poor to bad range.
•The response time for ESnet hosts averages at about 50ms, for N. America West it is about 80ms, for N. America East about 150ms and for International hosts around 200ms.
•Most of the unreachable problems are limited to a few hosts mainly in the International group (Dresden, Novosibirsk, Florence).
•The unpredictability is most marked for a few International hosts and roughly tracks the packet loss.