Slide 21 of 30
Notes:
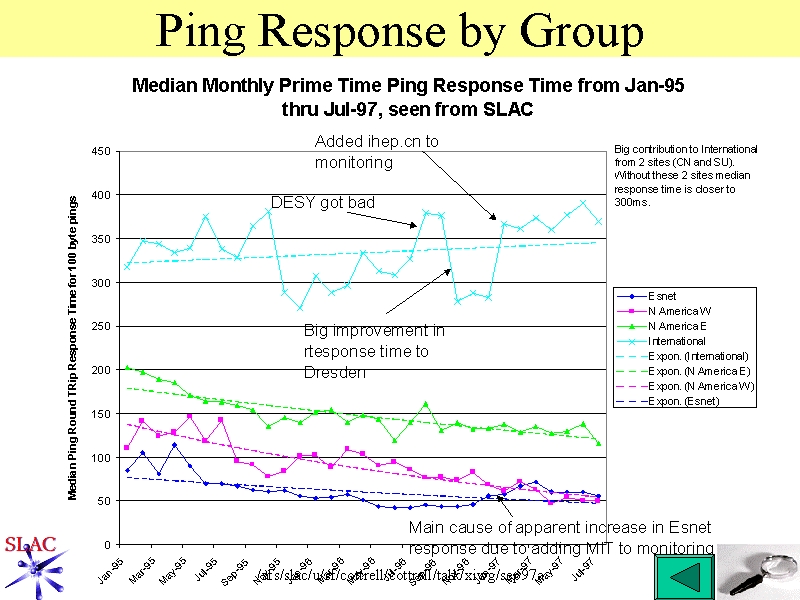
This graph was produced by displaying the table of monthly average response time versus site and using the TSV link to bring up Excel.