Inadequate throughput between SLAC and U Victoria, Dec 2006

Les Cottrell.
Page created: December 1, 2006
Central Computer Access | Computer Networking | Network Group | More case studies
|
|
Inadequate throughput between SLAC and U Victoria, Dec 2006
Les Cottrell.
Page created: December 1, 2006
|
|
Hi Les
We spoke a while ago about connectivity between SLAC and Victoria.
In the new year UVictoria will be hosting one of the babar working data sets (tau working group).
This will likely require the transfer of ~10 TB of data in Feb-Mar.

Currently we can transfer data to SLAC (we produce babar MC samples) and we copy analysis data
to UVic at rates around 30 mbits/s using a BbkImport command of babar.
This command uses
bbftp and 10 streams.

We are wondering how we can improve the transfer rate.   Our routing to SLAC from
Victoria (mercury.uvic.ca) is unfortunately not direct and we go to Calgary before entering the US.

I have cc'ed this email to Ian Gable who is the HEPNET/Canada technical manager,
Thomas Tam of CANARE and Ashok Agarwal of UVic (Ashok does most of the data transfer).
We recently set up a lightpath between UVic and TRIUMF.   Some of our colleagues in
Vancouver have a lightpath to Fermilab.   I am told that a lightpath solution may not
be possible in the short-term.

We would welcome your feedback and suggestions on how we improve our connectivity to SLAC.
Regards, Randy
The hosts involved at SLAC were noric.slac.stanford.edu and bbr-xfer06.slac.stanford.edu and at UVic according to Ashok Agarwal the host is called mercury.uvic.ca. Ian Gable provided an account on phys02.comp.uvic.ca. The Norics and phys02.comp.uvic.ca have 1Gbits/s NICs, have iperf 2.0.2 with pthreads, and have the out of the box TCP window configurations:
########################################
# TCP windows/buffer information       #
########################################
cat /proc/sys/net/core/wmem_max = 131071
;cat /proc/sys/net/core/rmem_max = 131071
;cat /proc/sys/net/core/rmem_default = 65535
;cat /proc/sys/net/core/wmem_default = 65535
;cat /proc/sys/net/ipv4/tcp_rmem = 4096 87380   174760
;cat /proc/sys/net/ipv4/tcp_wmem = 4096 16384   131072
;cat /proc/sys/net/ipv4/tcp_mem = 195584        196096  196608
The Norics are a cluster of dual 1.8GHz AMD Opteron cpu host running Linux 2.4.21-47.0.1.ELsmp #1 SMP. They are targeted at supporting interactive usage. Phys02.comp.uvic.ca is a dual 3.2GHz Intel Xeon cpu host running Linux 2.4.21-32.ELsmp #1 SMP. Mercury is actually two hosts nercury2 and mercury5.uvic.ca. They are 3.2 GHz hosts running Linux 2.4.21-32.0.1.ELsmp #1 SMP and according to Brian Fitzgerald [bfitz@uvic.ca] they have 1 GE NICs.
                                   Matt's traceroute  [v0.52]
iepm-bw                                                                 Thu Nov 30 17:10:08 2006
Keys:  D - Display mode    R - Restart statistics    Q - Quit
                                                            Packets               Pings
Hostname                                                 %Loss  Rcv  Snt  Last Best  Avg  Worst
 1. rtr-iepm-test.slac.stanford.edu                         0% 1336 1336     0    0    0     46
 2. rtr-core1-p2p-iepm.slac.stanford.edu                    0% 1336 1336     0    0    0     29
 3. rtr-dmz1-ger.slac.stanford.edu                          0% 1336 1336     0    0    1    199
 4. slac-rt4.es.net                                         0% 1336 1336     0    0    1     41
 5. slacmr1-slacrt4.es.net                                  0% 1335 1335     0    0    8    243
 6. snv2mr1-slacmr1.es.net                                  0% 1335 1335     0    0   10    352
 7. snv2sdn1-snv2mr1.es.net                                 0% 1335 1335     0    0    1     41
 8. seattlesdn1-snv2sdn1.es.net                             0% 1335 1335    18   18   18     38
 9. canet-1-lo-jmb-706.sttlwa.pacificwave.net               0% 1335 1335    40   40   42    245
10. c4-bcnet.canet4.net                                     0% 1335 1335    61   61   62    224
11. UVICA-ORAN.BC.net                                       1% 1334 1335    63   63   64    286
12. csc1cled050.bb.uvic.ca                                  1% 1334 1335    63   63   64    120
13. dmc2ell005.bb.uvic.ca                                   1% 1334 1335    63   63   64    130
14. ???
Packet loss is better than 0.1% (1 packet lost in 1334).
The traceroute from UVic to SLAC is:
[cottrell@phys02 cottrell]$ traceroute noric.slac.stanford.edu
traceroute to noric05.slac.stanford.edu (134.79.86.55), 30 hops max, 38 byte packets
 1  142.104.21.62 (142.104.21.62)  0.334 ms  0.175 ms  0.166 ms
 2  csc1cled050.bb.uvic.ca (142.104.252.165)  0.251 ms  0.272 ms  0.219 ms
 3  emc1cled050.bb.uvic.ca (142.104.252.246)  0.381 ms  0.396 ms  0.361 ms
 4  gigapop-ORAN.hc.BC.net (207.23.240.177)  2.522 ms  2.537 ms  2.515 ms
 5  c4-cal01.canet4.net (205.189.32.194)  23.250 ms  23.419 ms  23.047 ms
 6  esnet-1-lo-jmb-706.sttlwa.pacificwave.net (207.231.240.13)  45.533 ms  45.358 ms  45.241 ms
 7  snv2sdn1-seattlesdn1.es.net (134.55.218.26)  63.138 ms  63.169 ms  63.056 ms
 8  snv2mr1-snv2sdn1.es.net (134.55.207.38)  63.440 ms  63.162 ms  62.998 ms
 9  slacmr1-snv2mr1.es.net (134.55.217.1)  63.604 ms  63.513 ms  63.347 ms
10  slacrt4-slacmr1.es.net (134.55.209.94)  63.632 ms  63.688 ms  68.404 ms
11  rtr-dmz1-vlan400.slac.stanford.edu (192.68.191.149)  63.736 ms  63.531 ms  63.843 ms
12  * * *
13  noric05.slac.stanford.edu (134.79.86.55)  63.684 ms  63.520 ms  63.431 ms
1cottrell@iepm-resp:~>sudo /afs/slac.stanford.edu/package/netperf/bin/@sys/pathneck -x phys02.comp.uvic.ca
Kerberos Password:
1165080082.834362 142.104.21.13 500 60 0

00   0.305    134.79.243.1    844 rtr-iepm-test.slac.stanford.edu
01   0.279    134.79.252.5    823 rtr-core1-p2p-iepm.slac.stanford.edu
02   0.278   134.79.135.15    855 rtr-dmz1-ger.slac.stanford.edu
03   0.451  192.68.191.146    730 slac-rt4.es.net
04   0.639   134.55.209.93    534 slacmr1-slacrt4.es.net
05   0.925    134.55.217.2    622 snv2mr1-slacmr1.es.net
06   0.923   134.55.207.37    668 snv2sdn1-snv2mr1.es.net
07  18.375   134.55.218.25    751 seattlesdn1-snv2sdn1.es.net
08  40.681   207.231.240.3    699 canet-1-lo-jmb-706.sttlwa.pacificwave.net
09  61.308  205.189.32.193    643 c4-bcnet.canet4.net
10  63.354  207.23.240.189    584 UVICA-ORAN.BC.net

rtt = 63.696 ( 142.104.21.13 )
We also ran a pathneck to mercury.uvic.ca to see if it has a similar bottleneck (we were unsure what the NIC speed was on mercury) with following result:
5cottrell@iepm-resp:~>sudo /afs/slac.stanford.edu/package/netperf/bin/@sys/pathneck -x mercury.uvic.ca
1165080632.815491 142.104.193.217 500 60 0

00   0.336    134.79.243.1    789 rtr-iepm-test.slac.stanford.edu
01   0.246    134.79.252.5    818 rtr-core1-p2p-iepm.slac.stanford.edu
02   0.246   134.79.135.15    872 rtr-dmz1-ger.slac.stanford.edu
03   0.336  192.68.191.146    797 slac-rt4.es.net
04   0.502   134.55.209.93    615 slacmr1-slacrt4.es.net
05   0.887    134.55.217.2    634 snv2mr1-slacmr1.es.net
06   0.886   134.55.207.37    664 snv2sdn1-snv2mr1.es.net
07  18.330   134.55.218.25    760 seattlesdn1-snv2sdn1.es.net
08  40.638   207.231.240.3    731 canet-1-lo-jmb-706.sttlwa.pacificwave.net
09  61.247  205.189.32.193    816 c4-bcnet.canet4.net
10  63.165  207.23.240.189    788 UVICA-ORAN.BC.net

rtt = 63.663 ( 142.104.193.217 )
The columns are the hop number, the RTT, the IP address of the router and the time in microseconds in which the load packets are processed by that hop. The last column is the name of the node. By default the load packets are 33.3 KB. So, to calculate the dummy estimate of bandwidth, you need to divide 33300 by the longest time (844 microsecs for phys02.comp.uvic.ca). This yields a bottleneck available bandwidth of about 310 Mbits/s or 39MBytes/s.
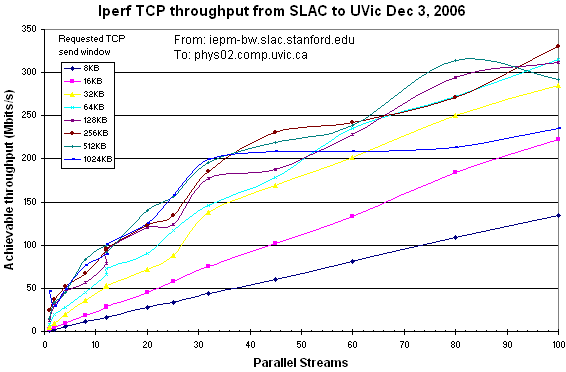
The slow start time (see Measuring end-to-end Bandwidth with iperf using Web100 by Tirumala, Cottrell and Dunigan) for an 800KByte bandwidth delay product is about 1 second, so using an iperf duration of 20 seconds means most of the transfer (~95%) is in the more stable Additive Increase Multiplicative Decrease (AIMD) TCP state.
The results are shown in the figure below. It is seen that for smaller values of window * streams the growth in throughput is roughly linear with the number of streams. Not that the maximum window size is constrained by the TCP window size configurationm parameters to be about 130KB and the requested window is doubled, so the difference in the results for the 64KB and 128KB windows is mainly statistical. It can also be seen that the TCP throughput achievable with iperf saturates at between 250 and 300 Mbits/s.
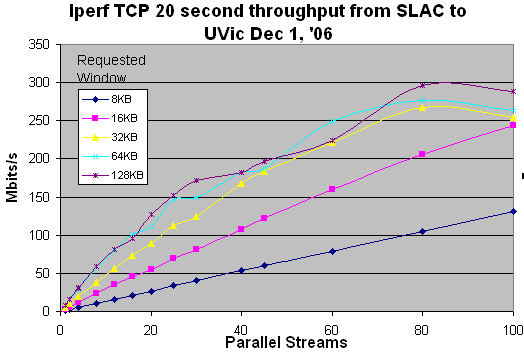
With the default configuration TCP windows size setting (~130KB) this requires one to use a large number of parallel streams (e.g over 60). If the windows sizes were to be increased (see TCP Tuning Guide) then the number of streams could probably be reduced. The problem with using a large number of streams is that it is unfair to other network users who are typically only using one stream. If one uses 10 streams as the current application is configured with the default max TCP window of ~130KB, then one ought to be able to achieve about 70Mbits/s. If this is not possible then it may be due to the application or file system/disks etc.
The Norics are a cluster of hosts that are meant for interactive work and thus should not have their TCP window sizes incsreased. The other host mentioned at SLAC, bbr-xfer06, is a four 450MHz processor Sun Sparcv9 running SunOS 5.9. The maximum cpu utilization in the measurements above with Noric was about 0.1% so CPU should not be a problem (note that within a factor of 2 Xeon/Linux and Solaris/SunOS hosts use the same MHz / Mbits/s). The maximum TCP window size on bbr-xfer06 is about 1MBytes. Thus if the window size at UVic is increased we can use bbr-xfer06 to retry iperf throughputs with larger windows (note that the actual window size used is the miniumum of the sender and receiver window sizes).
Other possibilities would be to:
45cottrell@iepm-resp:~>sudo ~mak/pathneck -v -o phys02.comp.uvic.ca
probe_once() with [60 0]
1165182286.865677 142.104.21.13 500 60 0

00   7.970    134.79.243.1    121    813 . 1981.561 ub
01   0.307    134.79.252.5    813    813 . 294.854 lb
02   0.285   134.79.135.15    851    851 . 281.970 lb
03   0.369  192.68.191.146    900    851 . 266.375 lb
04   0.582   134.55.209.93    686    686 3   0.000 uk
05   0.964    134.55.217.2    627    686 . 382.750 lb
06   0.963   134.55.207.37    772    736 . 310.498 lb
07  18.441   134.55.218.25    736    736 . 325.666 lb
08  40.847   207.231.240.3    704    736 . 340.885 lb
09  61.398  205.189.32.193    833    833 2 287.774 ub
10  63.466  207.23.240.189    963    963 1 248.982 ub
conf = 0.135 0.116 0.241

rtt = 63.686 ( 142.104.21.13 )
where:
    The 1st line:
    	probing_start_timestamp (local time), dst_ip, load_pkt_size,
	load_pkt_num, delay_num

    The main body (the 7-column thing):
    1st column:   the index number
    2nd column:   the RTT to that hop
    3rd column:	  hop IP address
    4th column:	  raw gap measurement (in microsecond)
    5th column:	  "smooth"ed gap values (in microsecond), they are also
    		  the input for the dynamic algo
    6th column:   choke points, "." represents non-choke point, "1", "2",
    		  "3" refers to the choke points (output at most 3), ordered
		  by the confidence value.
    7th column:   bandwidth bound estimation, unit: Mbps
    8th column:   ub->upper bound, lb->lower bound, uk->unknown (see the
	          pathneck paper section 2.3.3 for the detail.)
    9th column:   hop hostname

    The "conf" line:
    	the confidence values for the choke points detected, in the order of
	"1", "2", "3".

    The "rtt" line:
    	the RTT to the destination, dst_ip, and the hop count *from* dst to
	source (i.e., return path, not forward path).
Ian Gable of UVic set the TCP windows on phys02.comp.uvic.ca:
[root@phys02 init.d]# sysctl -p
net.ipv4.ip_forward = 0
net.core.rmem_max = 16777216
net.core.wmem_max = 16777216
net.ipv4.tcp_rmem = 4096 87380 16777216
net.ipv4.tcp_wmem = 4096 65536 16777216
net.ipv4.conf.default.rp_filter = 1
kernel.sysrq = 0
kernel.core_uses_pid = 1
At the SLAC end we used iepm-resp, a two 2.4GHz Xeon cpu with a 1GE NIC and windows set:
########################################
# TCP windows/buffer information       #
########################################
cat /proc/sys/net/core/wmem_max = 20971520
;cat /proc/sys/net/core/rmem_max = 20971520
;cat /proc/sys/net/core/rmem_default = 65536
;cat /proc/sys/net/core/wmem_default = 65536
;cat /proc/sys/net/ipv4/tcp_rmem = 4096 87380   20971520
;cat /proc/sys/net/ipv4/tcp_wmem = 4096 65536   20971520
;cat /proc/sys/net/ipv4/tcp_mem = 16384 16384   16384
On 12/3/06,we repeated the above iperf TCP throughput measurements but adding window sizes of 256kBytes, 512KBytes and 1024kBytes at the SLAC (sender) end and with phys02.comp.uvic.ca using a window size of 1MByte:
[cottrell@phys02 cottrell]$ iperf -s -w 1024k -p 5000
------------------------------------------------------------
Server listening on TCP port 5000
TCP window size: 2.00 MByte (WARNING: requested 1.00 MByte)
------------------------------------------------------------
The results are shown below.