Throughput for GLAST between SLAC and NRL Washington, May 2006
Central Computer Access | Computer Networking | Network Group | More case studies
|
|
Throughput for GLAST between SLAC and NRL Washington, May 2006Central Computer Access | Computer Networking | Network Group | More case studies |
|
[cxg@lat-dmz01 ~]$ traceroute glastlnx06
traceroute to glastlnx06.slac.stanford.edu (134.79.86.186), 30 hops max, 38 byte packets
 1  134.79.205.130 (134.79.205.130)  0.765 ms  0.784 ms  0.611 ms
 2  134.79.115.6 (134.79.115.6)  78.310 ms  78.533 ms  81.565 ms
 3  134.79.115.2 (134.79.115.2)  78.693 ms  78.358 ms  78.800 ms
 4  134.79.135.8 (134.79.135.8)  78.932 ms  79.743 ms  79.315 ms
 5  glastlnx06.slac.stanford.edu (134.79.86.186)  78.572 ms  80.680 ms  78.693 ms

7cottrell@glastlnx06:~>traceroute glast-mrb01
traceroute to glast-mrb01.slac.stanford.edu (134.79.205.144), 30 hops max, 38 by
te packets
 1  rtrg-farm0 (134.79.87.1)  0.583 ms  0.180 ms  0.166 ms
 2  rtr-core1-ger (134.79.135.2)  0.219 ms  0.186 ms  0.184 ms
 3  rtr-glastfw1 (134.79.115.6)  0.831 ms  0.833 ms  0.722 ms
 4  132.250.144.197 (132.250.144.197)  78.628 ms  78.173 ms  78.500 ms
 5  glast-mrb01 (134.79.205.144)  78.619 ms  78.673 ms  78.327 ms
The node at Maryland has the default Linux window sizes:
########################################
# TCP windows/buffer information       #
########################################
cat /proc/sys/net/core/wmem_max = 131071
;cat /proc/sys/net/core/rmem_max = 131071
;cat /proc/sys/net/core/rmem_default = 110592
;cat /proc/sys/net/core/wmem_default = 110592
;cat /proc/sys/net/ipv4/tcp_rmem = 4096 87380   174760
;cat /proc/sys/net/ipv4/tcp_wmem = 4096 16384   131072
;cat /proc/sys/net/ipv4/tcp_mem = 98304 131072  196608
The glastlnx06 node at SLAC similarly has very small TCP windows:
########################################
# TCP windows/buffer information       #
########################################
cat /proc/sys/net/core/wmem_max = 200000
;cat /proc/sys/net/core/rmem_max = 131071
;cat /proc/sys/net/core/rmem_default = 65535
;cat /proc/sys/net/core/wmem_default = 65535
;cat /proc/sys/net/ipv4/tcp_rmem = 4096 1400000 1400000
;cat /proc/sys/net/ipv4/tcp_wmem = 4096 16384   1400000
;cat /proc/sys/net/ipv4/tcp_mem = 195584        196096  196608
I do not know what the capacity of the link from SLAC to Maryland is expected to be. Most of the tools I would normally use to understand the link (pathneck, pathload etc.) probably will not work since the tools are not installed or the ports are blocked. Let's assume the bottleneck capacity is 100Mbits/s. Then the TCP window should be about a Mbyte. As set now, the maximum window size is the min of the two systems wmem_max (i.e. about 132KB). Charley logged me onto the NRL host and from NRL to SLAC using a single iperf TCP stream I was able to get between 3 and 8Mbits/s for 5 minutes averaged over 5 second intervals or an averge over 5 mins of 5.5Mbits/s. The iperf command was
iperf -c glastlnx06 -t 300 -w 128k -i 5 -t 300 | tee iperf-nrl1To get round the window size limitations (one needs root to change them, see http://www-didc.lbl.gov/TCP-tuning/buffers.html for what they should be set to for WAN usage) one can be aggressive and use multipe parallel streams. Doing this with 20 streams each with a window size of 50KB (well under wmem_max of the two systems, even allowing for the fact Linux doubles the window size requested) I get about 15.2Mbits/s averaged over a 5 minute period with a maximum 5 second average of just over 20Mbits/s. See the plot of the throughput as a time series. The iperf command used was:
iperf -c glastlnx06 -t 300 -w 50k -i 5 -t 300 -P 20 | tee iperf-nrlI get similar results in the reverse direction.
So you can be unfair and aggressively push your traffic using multiple streams with the current window size limits. You can increase the maximum window sizes and retry. I suspect it will not do as well as multiple parallel streams even then due to the way the stock TCP congestion avoidance algorithm works (it was designed for the days when fast links were 64kbps). So in addition you may need to experiment with a new TCP stack. The latest versions of Linux do support this. But you will need to be running Linux > version 2.6.12. The NRL host is running 2.6.9. The SLAC host is running 2.4.21. Only the sender needs to be updated.
blee@glastlnx06 $ /opt/pathneck/pathneck -xo glast-mrb01
1151104670.802114 134.79.205.144 500 60 0

00   2.263     134.79.87.1     81    931 . 2960.685 ub rtrg-farm0.slac.stanford.edu
01   0.347    134.79.135.2    931    931 . 257.517 lb rtr-core1-ger.slac.stanford.edu
02   2.682    134.79.115.6  50141  49095 1   4.786 ub rtr-glastfw1.slac.stanford.edu
03  89.316 132.250.144.197  49095  49095 .   4.888 lb 132.250.144.197
conf = 0.981

rtt = 88.691 ( 134.79.205.144 )
This indicates that there is a bottleneck of about 5Mbits/s at the hop labelled 02. This is the Nokia firewall at NRL.
We also made TCP iperf measurements from glastlnx06 to iepm-resp.slac.stanford.edu with a single stream and were able to achieve over 800Mbits/s thus eliminating glastlnx06 as being the cause of poor network throughput.
We logged onto glast-mrb01 and noticed that there was little free memory, however we do not believe this is a cause of poor performance since pathneck from glast-mrb01 to another node on the NRL LAN showed a bottleneck of about 400Mbits/s
blee@glastlnx06 $ /opt/pathneck/pathneck -xo 132.250.144.1
1151104688.230362 132.250.144.1 500 60 0

00   0.287     134.79.87.1    454    454 . 528.416 ub rtrg-farm0.slac.stanford.edu
01   0.282   134.79.135.15    494    494 . 485.827 lb rtr-dmz1-ger.slac.stanford.edu
02   0.318  192.68.191.146    560    513 . 427.808 lb slac-rt4.es.net
03   0.267   134.55.209.93    513    513 . 467.766 lb slacmr1-slacrt4.es.net
04   0.679    134.55.217.2    471    480 . 509.430 lb snv2mr1-slacmr1.es.net
05   0.699   134.55.207.37    480    480 . 499.074 lb snv2sdn1-snv2mr1.es.net
06  18.220   134.55.218.25    499    480 . 480.035 lb seattlesdn1-snv2sdn1.es.net
07 121.203   198.32.170.37    120    480 . 1997.288 lb dren-pwave.peer-1.pnw-gigapop.net
08  84.441      138.18.1.7    608    608 1 394.140 ub so12-0-0-0.nrldc.dren.net
conf = 0.211

rtt = 84.918 ( 132.250.144.1 )
| DNS name | Address | PingER alias | Function | Route from SLAC |
|---|---|---|---|---|
| glastlnx06.slac.stanford.edu | 134.79.86.186 | EDU.GLAST.SLAC | End host at SLAC | LAN |
| glast-mrb01.slac.stanford.edu | 134.79.205.144 | EDU.GLAST.NRL | Bastion host at NRL | VPN |
| ba59-97-hsrp-144.nrl.navy.mil | 132.250.144.1 | MIL.NAVY.NRL.N1 | Netgear firewall at NRL (admin by NRL) | ESnet |
| rtr-glastfw3.slac.stanford.edu | 134.79.205.130 | Not measured | Nokia firewall at NRL (admin by SLAC) | VPN |
| 132.250.144.197 | 132.250.144.197 | Does not ping | ???? | |
| xerver1.nrl.navy.mil | 132.250.110.45 | MIL.NAVY.NRL.XSRV1 | XServer host on NRL LAN | Internet2 |
| End host | Min-RTT | Avg-RTT | Max-RTT | IPDV |
|---|---|---|---|---|
| nrl-netgear-fw IQR | 0.087 ms | 0.089 ms | 0.163 ms | 0.078 ms | glast-mrb01 IQR | 0.34 ms | 5.44 ms | 41.8 ms | 9.55 ms |
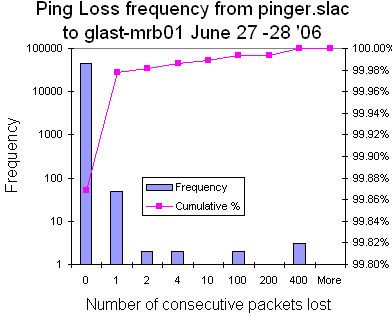
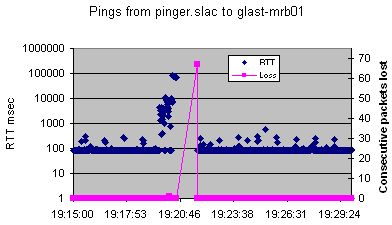
The large losses seen to glast-mrb01 suggested looking at that path in more detail. We therefore ran pings from pinger.slac.stanford.edu to glast-mrb01, one ping per second starting at 6pm 6/27/06 until 6:30am 6/28/07 (~12.5 hours or ~45,000 pings). We plotted the data using Excel from 6:00pm 6/27/06 to 3:00pm 6/28/06 (Excel can only plot 32,000 points). Looking at the plot two loss spikes are seen with ~45 and ~ 300 consecutive pings being lost. If one looks at the frequency histogram of the losses from all of 12.5 hours of data, then one sees about 48 instances of a single packet being lost, 2 instances of 2 consecutive packets being lost, 2 instances of 3-4 consecutive packets being lost, two of 10-100 packets, and 3 of 200-400 packets. This is not a normal statistical loss behavior. Looking in detail at the 65 consective packet outage it can be seen that there was a massive increase in RTTs preceding the outage. A similar effect is seen for the other outage.
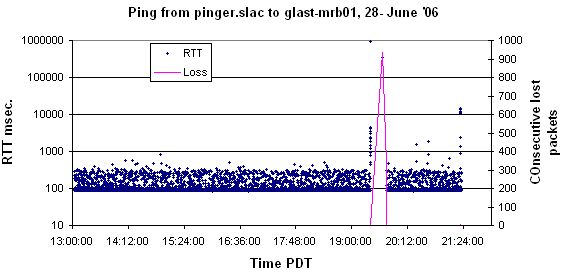
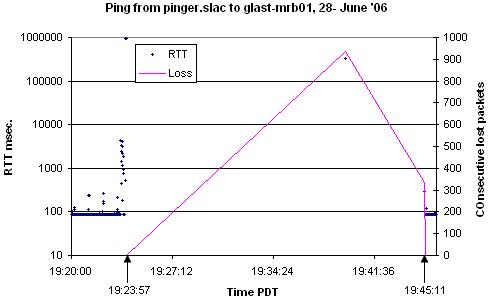
We repeated the ping measumurement with 32K pings at 1 second intervals between pinger.slac.stanford.edu and glast-mrb01 from about 13:00 to about 22:00 June 28 '06. At the same time I measured the traceroutes at 10 minute intervals from iepm-bw.slac.stanford.edu to ba59-97-hsrp-144.nrl.navy.mil (132.250.144.1) AKA node1.glast.nrl.navy.mil in the URL above and to xserver1.nrl.navy.mil (132.250.110.45) AKA node2.glast.nrl.navy.mil. Node1 is over Esnet/DREN, Node2 is over Stanford/CENIC/I2/DREN. No changes in either route were seen. However there was a long outage of ~ 935 seconds from 19:23 to 19:47 PDT seen in the time-series. More detail on the outage illustrate the build up in RTTs before the outage. The frequency histogram of the ping RTTs is not as expected (usually it obeys a power law i.e. a straight line on a log-log plot). I am wondering if the long plateau after 120ms maybe an artifact of the VPN and/or possibly the encryption. Also the large number of RTTs of over 1 second seem to presage an outage. The histogram of consecutive packet loss is very heavy-tailed indicating long bursts of losses. The two bursts of 935 consecutive packets lost and 336 consecutive packets lost occured back to back at 19:39:33 and 19:45:10. Ping packets were seen immediately before and after these outages at 19:23:57 and 19:45:10. The causes of burst losses can include the convergence time required after a routing change (10s to 100s of seconds), loss and recovery of sync in DSL network (10-20 seconds), and bridge spanning tree re-configurations (~30 seconds) among other things.
Jean Pierre was monitoring the glastfw1 performance at this time. It sees that the decrypted packet rate went to zero at this time confirming the fact no data was transferred. However the virtual memopry use stated constand across this time so it appears the firewall did not crash.
/afs/slac/package/netmon/netflow/src/flowmine -switch 134.79.199.14 -proto 50 -date "6/28/06" | tee /tmp/netflow
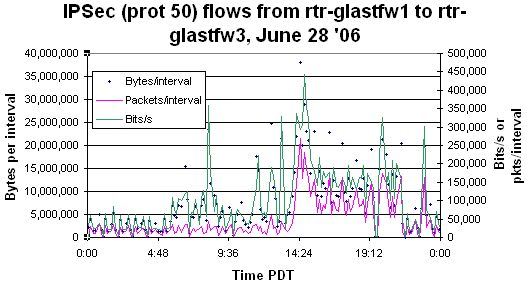
The netflow fw1 to fw3 time series of Bytes and packets per interval (~ 5 mins) and Bits/s show there is very little traffic as can be seen by looking at the details between 19:00 and 20:00 hours. The netflow fw3 to fw1 time series also shows almost no traffic between 19:27 and 19:48 hours. This can be seen more clearly in the detail between 19:00 and 20:00 hours. Note the log scale for the packets/interval and bits/s ponts in both the detail plots.
The fact that packets are being seen inbound and outbound, albeit at much lower throughput duting the outage, suggests that the problem is uni-directional. E.g. glast-mrb01 is not receiving acknowledgement packets from glastlnx06 and is timing out and resending the data.
1cottrell@glastlnx06:~>traceroute glast-mrb01
traceroute to glast-mrb01.slac.stanford.edu (134.79.205.144), 30 hops max, 38 byte packets
 1  rtrg-farm0 (134.79.87.1)  0.331 ms  0.184 ms  0.167 ms
 2  rtr-core1-ger (134.79.135.2)  0.211 ms  0.194 ms  0.188 ms
 3  rtr-glastfw1 (134.79.115.6)  0.857 ms  0.756 ms  0.740 ms
 4  132.250.144.197 (132.250.144.197)  98.482 ms  100.216 ms  86.862 ms
 5  glast-mrb01 (134.79.205.144)  87.211 ms  88.588 ms  88.356 ms
This tunnel is carried through various router switches which do not show up. Instead therefore, we could think of measuring the traceroutes from slac to the Netgear router at NRL (132.250.144.1), since I believe this router carries the VPN tunnel. If one does this then the route goes via ESnet due to the host routes in glastlnx06. The route looks good up to hop 10 but then gets into a nasty loop with !X indicating that the communication onwards is adminsitratively prohibited:
3cottrell@glastlnx06:~>traceroute 132.250.144.1
traceroute to 132.250.144.1 (132.250.144.1), 30 hops max, 38 byte packets
 1  rtrg-farm0 (134.79.87.1)  0.459 ms  0.186 ms  0.166 ms
 2  rtr-dmz1-ger (134.79.135.15)  0.237 ms  0.222 ms  0.205 ms
 3  slac-rt4.es.net (192.68.191.146)  0.764 ms  0.318 ms  0.289 ms
 4  slacmr1-slacrt4.es.net (134.55.209.93)  0.381 ms  0.703 ms  0.740 ms
 5  snv2mr1-slacmr1.es.net (134.55.217.2)  1.544 ms  0.703 ms  0.607 ms
 6  snv2sdn1-snv2mr1.es.net (134.55.207.37)  0.673 ms  0.636 ms  0.642 ms
 7  seattlesdn1-snv2sdn1.es.net (134.55.218.25)  18.232 ms  18.305 ms  18.243 ms
 8  dren-pwave.peer-1.pnw-gigapop.net (198.32.170.37)  65.741 ms  65.719 ms  65.696 ms
 9  so12-0-0-0.nrldc.dren.net (138.18.1.7)  84.338 ms  84.481 ms  84.400 ms
10  * * *
11  * cperouter.nrldc.dren.net (138.18.23.34)  84.665 ms !X *
12  * * *
13  * * cperouter.nrldc.dren.net (138.18.23.34)  85.585 ms !X
14  * * *
15  * * *
16  * cperouter.nrldc.dren.net (138.18.23.34)  84.510 ms !X *
17  * * *
18  * * *
19  * * *
20  * * *
21  * * *
22  * * *
23  * cperouter.nrldc.dren.net (138.18.23.34)  85.736 ms !X *
24  * * *
25  * * *
26  * * *
27  * cperouter.nrldc.dren.net (138.18.23.34)  84.433 ms !X *
28  * * *
29  * * *
30  * * cperouter.nrldc.dren.net (138.18.23.34)  84.455 ms !X
So maybe one could only measure the traceroute up to hop 10, however that route goes via Stanford, CENIC, I2 rather than Esnet:
17cottrell@pinger:~>traceroute 138.18.1.7 traceroute to 138.18.1.7 (138.18.1.7), 30 hops max, 38 byte packets
 1  rtr-test-test (134.79.243.1)  0.416 ms  0.412 ms  0.399 ms
 2  rtr-core1-p2p-test (134.79.252.5)  0.454 ms  0.441 ms  0.625 ms
 3  rtr-dmz1-ger (134.79.135.15)  29.907 ms  0.437 ms  0.387 ms
 4  i2-gateway.stanford.edu (192.68.191.83)  0.549 ms  0.418 ms  0.478 ms
 5  hpr-svl-hpr--stan-ge.cenic.net (137.164.27.161)  0.841 ms  0.915 ms  0.852 ms
 6  lax-hpr--svl-hpr-10ge.cenic.net (137.164.25.12)  8.600 ms  8.511 ms  8.968 ms
 7  abilene-LA--hpr-lax-gsr1-10ge.cenic.net (137.164.25.3)  8.588 ms  8.512 ms  8.478 ms
 8  snvang-losang.abilene.ucaid.edu (198.32.8.95)  15.952 ms  16.024 ms  15.957 ms
 9  198.32.153.25 (198.32.153.25)  57.580 ms  57.895 ms  57.551 ms 10  138.18.4.26 (138.18.4.26)  13.332 ms  13.234 ms  12.938 ms
11  jn1-so7-0-0-700.dng.vbns.net (204.147.137.59)  81.548 ms  81.526 ms  81.735 ms
12  js1-so6-1-0-0.dng.vbns.net (204.147.136.190)  81.788 ms  85.371 ms  88.277 ms
13  js1-so6-3-0-0.nor.vbns.net (204.147.136.194)  89.914 ms  89.477 ms  88.909 ms
14  js1-so6-3-0-0.ray.vbns.net (204.147.136.173)  80.921 ms  80.821 ms  80.784 ms
15  so12-0-0-0.nrldc.dren.net (138.18.1.7)  76.415 ms  76.338 ms  76.694 ms
Fortunately we heard from Dave Burton of NRL that ICMP traceroutes work so we will use that:
4cottrell@glastlnx06:~>traceroute -I 132.250.144.1
traceroute to 132.250.144.1 (132.250.144.1), 30 hops max, 38 byte packets
 1  rtrg-farm0 (134.79.87.1)  0.270 ms  0.171 ms  0.163 ms
 2  rtr-dmz1-ger (134.79.135.15)  0.250 ms  0.220 ms  0.228 ms
 3  slac-rt4.es.net (192.68.191.146)  0.483 ms  0.613 ms  0.852 ms
 4  slacmr1-slacrt4.es.net (134.55.209.93)  1.280 ms  1.144 ms  0.834 ms
 5  snv2mr1-slacmr1.es.net (134.55.217.2)  0.828 ms  0.655 ms  0.601 ms
 6  snv2sdn1-snv2mr1.es.net (134.55.207.37)  0.691 ms  0.637 ms  0.698 ms
 7  seattlesdn1-snv2sdn1.es.net (134.55.218.25)  18.263 ms  18.263 ms  18.192 ms
 8  dren-pwave.peer-1.pnw-gigapop.net (198.32.170.37)  65.598 ms  66.856 ms  67.076 ms
 9  so12-0-0-0.nrldc.dren.net (138.18.1.7)  84.242 ms  87.147 ms  84.263 ms
10  cperouter.nrldc.dren.net (138.18.23.34)  84.418 ms  85.293 ms  84.410 ms
11  ba59-97-hsrp-144.nrl.navy.mil (132.250.144.1)  84.644 ms  84.694 ms  87.818 ms
As of about 1:00pm 6/28/06 we set up traceroute monitoring from iepm-bw.slac.stanford using ICMP probes to ba59-97-hsrp-144.nrl.navy.mil (132.250.144.1) AKA node1.glast.nrl.navy.mil (over ESnet, DREN) and to xserver1.nrl.navy.mil (132.250.110.45) AKA node2.glast.nrl.navy.mil (over Stanford, CENIC, I2, DREN). The results can be found here.
Prior to the outage, iperf was measuring 8-12 Mbits/sec bandwidth across the tunnel NRL -> SLAC. Since the connectivity was restored, iperf has consistently measured 600-800 Kbits/sec bandwidth across the tunnel.
We saw this kind of order-of-magnitude reduction in bandwidth once before; we never determined the exact cause, although NRL indicated that they replaced some fiber path associated with the DREN connection coincident with a restoration of the ~8 Mbits/sec throughput. I believe the replacement was done sometime between 15:10 and 16:40 UTC on Wednesday, 7 June.
We will not be able to keep up with the data volume from the instrument at 600-800 Kbits/sec, so we need to restore the link to it's previous capability.
Looking at the traceroutes from iepm-bw.slac.stanford.edu to ba59-97-hsrp-144.nrl.navy.mil there was a change in the route starting after 3:35am and before 3:55am PDT that corresponds to the loss of connectivity seen above.
#command = /usr/sbin/traceroute -q 1 -w 2 -I   node1.glast.nrl.navy.mil
#fromnode=iepm-bw.slac.stanford.edu
#date=Wed Jul 12 03:45:23 2006
#endtime=1152701123
#code=ok
#aliasname=node1.glast.nrl.navy.mil=5=115
#traceroute to 132.250.144.1 (132.250.xxx.xxx), 30 hops max, 38 byte packets
   1  rtr-test-test (134.79.243.1)  0.293 ms
   2  rtr-core1-p2p-test (134.79.252.5)  0.251 ms
   3  rtr-dmz1-ger (134.79.135.15)  0.250 ms
   4  slac-rt4.es.net (192.68.191.146)  0.417 ms
   5  slacmr1-slacrt4.es.net (134.55.209.93)  0.268 ms
   6  snv2mr1-slacmr1.es.net (134.55.217.2)  0.628 ms
   7  snv2sdn1-snv2mr1.es.net (134.55.207.37)  0.708 ms
   8  seattlesdn1-snv2sdn1.es.net (134.55.218.25)  18.277 ms
   9  dren-pwave.peer-1.pnw-gigapop.net (198.32.170.37)  65.207 ms
  10  so12-0-0-0.nrldc.dren.net (138.18.1.7)  83.771 ms
  11  cperouter.nrldc.dren.net (138.18.23.34)  219.093 ms
  12  node1.glast.nrl.navy.mil (132.250.xxx.xxx)  83.958 ms


#command = /usr/sbin/traceroute -q 1 -w 2 -I   node1.glast.nrl.navy.mil
#fromnode=iepm-bw.slac.stanford.edu
#date=Wed Jul 12 03:55:40 2006
#endtime=1152701740
#code=ok
#aliasname=node1.glast.nrl.navy.mil=5=115
#traceroute to 132.250.144.1 (132.250.xxx.xxx), 30 hops max, 38 byte packets
   1  rtr-test-test (134.79.243.1)  0.238 ms
   2  rtr-core1-p2p-test (134.79.252.5)  0.208 ms
   3  rtr-dmz1-ger (134.79.135.15)  0.230 ms
   4  slac-rt4.es.net (192.68.191.146)  0.288 ms
   5  slacmr1-slacrt4.es.net (134.55.209.93)  46.687 ms
   6  snv2mr1-slacmr1.es.net (134.55.217.2)  0.695 ms
   7  snv1mr1-snv2mr1.es.net (134.55.217.5)  0.743 ms
   8  snvcr1-snv1mr1.es.net (134.55.218.21)  0.760 ms
   9  snvrt1-ge0-snvcr1.es.net (134.55.209.90)  0.869 ms
  10  fix-west.dren.NET (192.203.230.25)  49.715 ms
  11  so12-0-0-0.nrldc.dren.net (138.18.1.7)  68.137 ms
  12  cperouter.nrldc.dren.net (138.18.23.34)  68.263 ms
  13  node1.glast.nrl.navy.mil (132.250.xxx.xxx)  68.314 ms
The new route appears to hand off from ESnet to DREN at FIX-West rather than Seattle. The route was restored between 4:35am and 4:45am. The route topologies are seen here where the normal route is the one to the left. This change corresponds to a scheduled ESnet outage where Level3 technicians replaced an OECP card in Sunnyvale. Given what Charley found (below) concerning rebooting the firewall fixing things, I am wondering if the route changes are somehow getting the firewall into a state that persists after the route is restored.
This route change occured before the Fix-West hand-off was fixed to allow VPN packets through (fixed Friday), so for an hour or so we (Charley and I) saw no Netflow traffic.
Charley Granieri wrote:
After we debugged the Internet2-DREN problem, I verified that I could only pass about 500 Kbps
from glast-mrb01 to glastlnx06 using the nuttcp test problem. I tested with the connection
from SLAC to NRL via Internet2 and via Esnet with the same result. At the same time, nuttcp
traffic from an NRL node to glastlnx06 (i.e. not thru the VPN tunnel) was 5 Mbps. I decided
to reboot the GLAST firewall at NRL. For some unknown reason, it took about 1 hour for the
reboot to complete, but once the reboot finished the nuttcp throughput was 5 Mbps
from glast-mrb01 to glastlnx06.