Emittance Measurement
Software
Engineering Design
Document
1 Scope (Levels of Design Detail)
This document describes the requirements (design details to
be added later) of the high level software application that measures,
calculates, and displays/outputs emittance and Twiss parameters. Additionally, the software application
can perform betatron matching.
1.1 Introduction
“The transverse electron emittance can be measured along the
LCLS accelerator at various locations using various techniques. The locations, components, and methods
are summarized here. The method
can be a multi-screen (or multi-wire) technique, where transverse beam size
measurements are made at ≥3 different, but neighboring locations, or it can be
a quad-scan (single-screen or single-wire) method, where the transverse beam
size is measured at one location for ≥3 different upstream quadrupole magnet
gradient settings. These standard
techniques are used to measure the time-integrated, or projected emittance over
the full bunch length. In addition,
the quad-scan method can be used to make a time-sliced, or slice-emittance,
measurement, where the transverse beam size in one dimension (x or y) is sliced
as a function of its extent in the other transverse dimension (y or x). The slice-emittance measurements are
identical to the projected emittance methods, except that the emittance is
calculated for every beam slice (typically 10 slices).”[1]
1.2 References
LCLS High
Level Software Applications Requirements, P Krejcik / B. Dalesio, PRD
1.1-307
Emittance Measurements in the LCLS, P. Emma, PRD
1.1-012 (url after posting)
XAL
Accelerator Class Hierarchy
1.3 Assumptions
This document assumes the use of the Java-based XAL
software, to be modified for LCLS.
XAL, developed by the Accelerator Physics Group, Oak Ridge National
Laboratory, is a Java framework for developing accelerator based applications,
provides a common toolset (including pv logger), and supports online modeling.
It is important to note that XAL has a distributed, three-tier Model/View/ Control (MVC) architecture. The data access, or Model layer of MVC (“Model” in this context should not be confused with the optics or online model), is comprised of the “standard machine format” (smf) package which contains the classes which access the accelerator nodes (devices) at the lowest level using java channel access (jca). This smf package may also be accessed via matlab. The User Interface (UI), or View layer of MVC is rendered via XAL’s common application framework with Java Swing GUI components. The View layer could also be rendered via matlab, with a data access layer using either smf or labca. The MVC Control layer will be comprised of various classes in support of each component and its associated UI. Control layer classes that are not in support of UI (as well as smf) must have a public Application Program Interface (API) to support programmatic access.
2 Requirements
2.1 Physics
2.1.1 Emittance Measurement Locations and Configurations
“Table 1 summarizes the
various locations and types of transverse emittance measurements presently
envisioned throughout the LCLS accelerator. Here “WS” indicates a wire-scanner and “OTR” or “YAG”
indicates a screen.
Table 1. Summary of emittance measurement
locations and methods. All quadrupole magnets varied here have their own
separate power supplies. Entries
above the double line are needed in 2007, while entries below this point are
needed in 2008. All quadrupole
magnets are new for LCLS, except those noted as existing.”[2]
|
method |
profile(s) |
region |
plane |
quadrupole varied |
Projected, Slice, or Both |
|
quad-scan |
YAG01 |
gun |
x or y |
SOL1 |
P |
|
muti-wire |
WS01,WS02, WS03 |
injector |
x or y |
- |
P |
|
muti-screen |
OTR1,OTR2, OTR3 |
injector |
x or y |
- |
P |
|
quad-scan |
WS02 |
injector |
x |
QE03 |
P |
|
quad-scan |
OTR2 |
injector |
x |
QE03 |
B |
|
muti-wire |
WS11,WS12, WS13 |
post-BC1 |
x or y |
- |
P |
|
quad-scan |
OTR11 |
BC1 |
y |
Q21201* |
S |
|
quad-scan |
OTR12 |
post-BC1 |
x |
QM12 |
B |
|
muti-wire |
WS21,WS22, WS23, WS24 |
pre-BC2 |
x or y |
- |
P |
|
muti-wire |
WS044,WS144, WS444, WS544 |
post-BC2 |
x or y |
- |
P |
|
muti-wire |
WS31,WS32, WS33, WS34 |
LTU |
x or y |
- |
P |
|
quad-scan |
OTR33 |
LTU |
x |
QEM3V |
B |
* Existing (legacy) linac quadrupole magnet.
Note: It is not required for the existing
linac quadrupole magnet to have control from LCLS in time for December 2006
injector commissioning.
2.1.2 High Level Software
2.1.2.1 Transverse emittance reconstruction[3]
· Should
be adaptable to any part of the machine where there are beam profile
measurements available
· Two
types of emittance measurement depending on whether a single beam profiling
device is used in conjunction with a quadropole scan, or using multiple beam
profiling devices distributed in a transport line.
· Also
– slice - A single beam profiling device (OTR, YAG) whose projection is
sliced “n times”, where “n” is user selectable
· Initiate
beam profile scans using default or user supplied scan ranges and settings.
· Beam
sizes as a function of quadropole strength or or profile monitor location are
processed along with online model information to return emittance and twiss
parameters of the beam.
· Output
user interface to determine errors and quality of measurement.
2.1.2.2 Beta matching[4]
· Uses
twiss parameters from emittance measurement in combination with online optics
model to predict changes to user specified matching quadropoles to achieve
design twiss parameters at a user specified location.
2.2 Security
· Who
is allowed to do invasive operations in the production system – from the
Control room only? This has some affect on the software architecture (ie,
monlithic versus stand-alone application designs) .
2.3 Functional
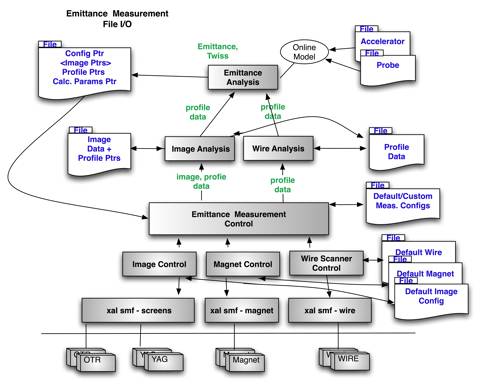
2.3.1 Block Diagram
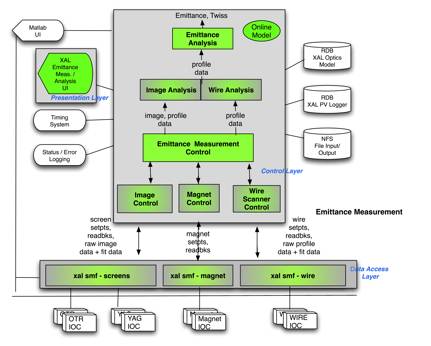
Figure 1 Emittance Measurement
Subsystem and Interfaces
Emittance Measurement is broken up into “layers”, or
components. At the lowest level is device I/O, while at the highest level
emittance calculations are output. The following section details the
functionality and requirements for each component in the Block Diagram.
2.3.2 Emittance Measurement Components
Functionality of emittance measurement is divided into the
following components:
· Low
level xal smf (simple machine format) classes that provide channel access
value-added “wrappers” for the input and output of EPICS process variables for
all devices.
· Image
Control for controlling all YAGS, OTRS
· Magnet
Control for new LCLS magnet-like devices
· Wire
Scanner Control for all WIREs
· Emittance
Measurement Control
o Controls
measurement method, diagnostic device selection, progress tracking,
error/status/machine state logging
· Image
Analysis for screens
o Collects
# image samples times (# screens
or # magnet settings or # slices) sets of image data and even more associated
profile data -times the # fitting algorithms
o Provides
graphical tools for the user to analyze screen images and their associated
projected beam profiles in detail
· Wire
Analysis for wires
o Collects
# wire scanners times (# magnet settings) sets of profile data – times
the # fitting algorithms
o Provides
graphical tools for the user to analyze projected beam profiles in detail
· Emittance
Analysis
o Read
transfer matrices from on-line model
o Calculate
Emittance and Twiss parameters and associated standard deviations
o UI:
display phase space, scatter plot of results along with standard deviations
o Perform
beta matching
· Online
Model
o Contains R matrix values for all points along the beamline for calculating emittance / Twiss
Each of these functions are discussed in detail below.
2.3.2.1 Low level device control (xal smf)
Xal provides a set of value-added java classes which
communicate via channel access to accelerator-type devices. (Refer to XAL Accelerator Class
Hierarchy)
These simple machine format (smf ) classes will be modified where necessary to communicate with LCLS IOC epics data. Additional classes will be added for the new screen profile monitors.
2.3.2.2
Image Control
The Image Control component is used by Emittance
Measurement, Bunch Length Measurement, and the Image Control GUI. Image Control
uses the smf layer for communication with YAG/OTR controllers (IOCs).
Image Control for emittance measurement includes control
for:
· Common
“number of image samples” setpoint for all (multi-)screen device(s) involved.
· Common
“number of background image samples” setpoint for for all (multi-)screen
device(s) involved.
· Number
of slices per image (1-N)
· Selection
of x or y plane setpoints
· Beam
rate control setpoint
· Full
image / cropped image / fitted
beam profile setpoints to control data processing of raw data readbacks
· Subtract
/ don’t subtract background image setpoint
· Save
as default configuration
Magnet
Control
For commissioning, magnet control could be directly via smf.
Eventually stand-alone magnet control will have a GUI and support classes layered on top of smf.
Magnet control for emittance measurement includes control
for:
· Magnet
minimum setpoint
· Magnet
maximum setpoint
· Number
of settings
· Save
as default configuration
2.3.2.3
Wire Scanner Control
Refer to Doug’s document Wire Scanner EDD; also Wire Scanner
Control under Interfaces section below. The Wire Scanner Control uses the smf
layer to communicate with the Wire Scanner IOC.
Control for emittance measurement includes:
· Scan
ranges and detectors
· Current
normalization selection
· Centroid
normalization selection
· Save
as default configuration
2.3.2.4 Emittance Measurement Control
Configures, controls, and tracks the requested emittance
measurement:
· Measurement
method and diagnostic device selection (further detailed below)
o Save
emittance measurement configuration
· Start
measurement
· Cancel
measurement
· Track
progress of overall measurement
· Track
progress of individual scans within overall measurement
o UI:
for screen measurements, display “free-run” image of each screen as it is
inserted
· Capability
to Restore last emittance measurement configuration and associated data
o Emittance
measurement configs – default and custom
o Image
data
o Fitted
Beam Profile data (same format for screens and wire scanners)
o Emittance
and twiss calculations
· Report
status/errors to various clients (event log, console, cmlog, elog)
· Store
machine state at time of measurement to PV Logger
Measurement Method and
Diagnostic Device Selection
Provide emittance measurement method selection, to include
(more detail below):
· Multi-wire
measurement
· Multi-screen
measurement
· Quad-scan
using one wire
· Quad-scan
using one screen
· Slice
emittance using quad-scan with one screen
2.3.2.4.1 Multi-wire
· Select
“n” number of wire scanners, where “n” >= 3
· Each
wire scanner may have a unique default configuration
· Each
wire is inserted and scanned consecutively, automatically
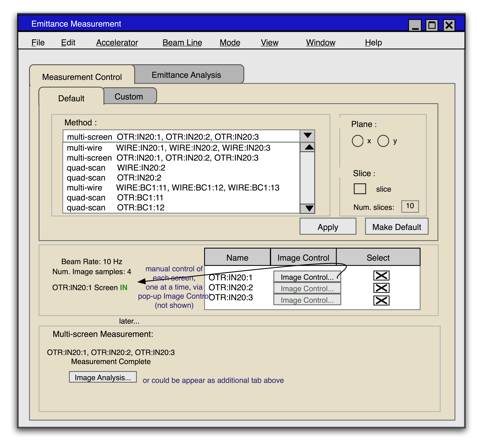
2.3.2.4.2 Multi-screen
· Select
“n” number of screens, where “n”
>= 3
· Each
screen must have identical default configuration
· Each
different screen is inserted and measured consecutively, under manual control
· For
each screen, “I” number of images (beam pulses) are requested
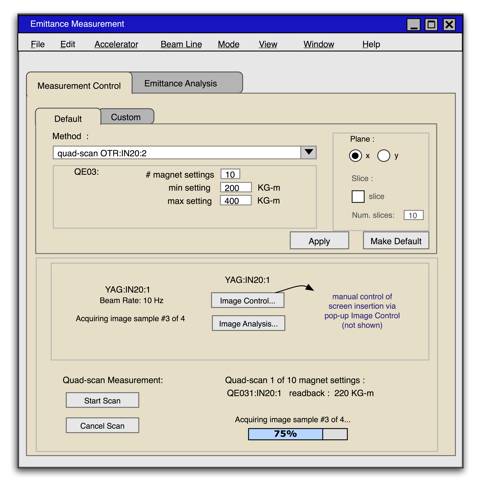
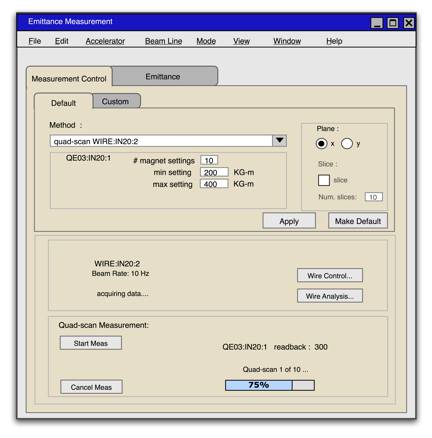
2.3.2.4.3 Quad-scan
· Select
a) magnet and b)one wire or screen
· Note:
new LCLS magnets only prior to commissioning
· Default
magnet configuration, as defined via emittance measurement application, is used
for the measurement, unless user overrides via Magnet Control
· Chosen
magnet associated with wire or screen is incrementally stepped with “n” number
of setpoints, from a minimum setting to a maximum setting (in kG-m).
· For
a screen - the screen is inserted
“In” via user command, and once inserted, the magnet is stepped through its “n”
setpoints manually on command. The screen is then parked in the “Out” position
on command.
o “I” number of images (beam pulses) are
requested per magnet setting
2.3.2.4.4 Slice (using quad-scan and screen)
· All
requirements for quad-scan above, but using a screen only; also select number of slices
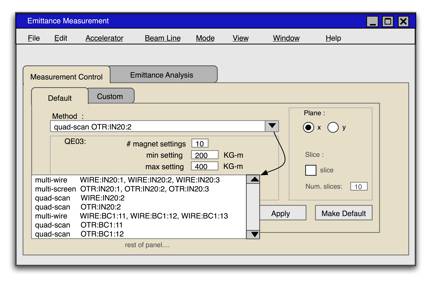
2.3.2.4.5 Measurement Method configurations
· Provide
a default set of measurement methods, according to Table 1
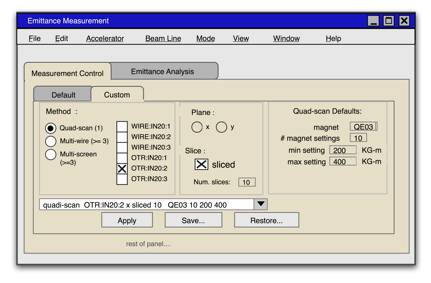
· Also
provide for “custom” user-defined measurement configurations, with any
combinations of parameters from Table 1.
· Configuration
parameters to include wire(s), screen(s), magnet devices/settings, plane (x,y),
number of slices
2.3.2.4.6
Device Configurations
· Provide
default configuration settings for each device which are unique to the
Emittance Measurement application
· User
may override defaults for a device using Image Control, Wire Scanner Control,
or Magnet Control
· Configuration
parameters include device setpoints – generally all relevant controls
available via Image Control, Wire Scanner Control, Magnet Control
2.3.2.5 Image Analysis
Image Analysis is a component used by Emittance Measurement, Bunch Length
Measurement, and Image Control. Image Analysis monitors requested data and can
display to a GUI when the user desires a detailed view of any image and its
associated beam profiles.
Refer to http://www.slac.stanford.edu/~zelazny/slaconly/LCLS/Image%20Analysis%20and%20Control/ ; “Image Analysis” and “Individual
Image Analysis” for the proposed UI for Image Analysis.
Image Analysis for emittance measurement includes:
· Provide
raw image, fitted beam profiles, “free-run image”
o Beam
profile data is fitted using all of the following algorithms:
§ Gaussian
§ Asymmetric
Gaussian
§ RMS
with Baseline Cut
§ Other(s)
TBD – algorithm expansion capability
· UI:
image data has auto/manual crop, auto/manual background image subtraction
· For
screen(s) involved in measurement (multi-screen or quad-scan using a screen),
per screen (OTR/YAG):
o Provide
“I” number of images acquired by the measurement , (UI: scrollable)
§ Selectable
in x or y plane.
§ Selectable
by screen name (if more than one) -
Data Set #1-#N = individual
screen names
§ Provide
beam profile data selectable by fitting algorithm.
§ Calculated
parameters include:
· …
· For
quad-scan with screen, all of the above except:
o One
plane only (x or y is indicated)
o Selectable
by quad setting
Data Set tabs #1-#N = quad
settings (numeric or BDES?) -
o (UI)
With “I” number of images displayed,
selectable by slice number.
§ Highlight
slice area (or line boundaries either side) currently being displayed by slice
number selection
o Calculated
parameters (UI: adjacent to each image) include calculated emittance (for all
“I” number of images)
o ?Calculate
sliced energy spread using the slices – possible at OTR4, OTRS1, YAGS2,
OTR30, at a minimum. (is sliced energy spread stand-alone, or used in
conjunction with a quad-scan?)
· For
sliced quad-scan with screen, all of the above, except:
o Selectable
by Slice #, 1-N
o Calculated
parameters include calculated emittance per slice, and for all “I” number of
images
2.3.2.6 Wire Analysis
Wire Analysis is used by Emittance Measurement and Wire
Scanner Control. It is similar to Image Analysis, with the exception that no
images are provided or manipulated; only beam profiles, in the same format as
the screen beam profiles.
Wire Analysis for emittance measurement includes:
· Provide
fitted beam profile data, parameter data
o Data
is fitted using various algorithms:
§ Gaussian
§ Asymmetric
Gaussian
§ RMS
with Baseline Cut
§ Other(s)
TBD – algorithm expansion capability
· UI:
edit data / recalculate beam size parameters capability
· For
wire(s) involved in measurement (multi-scan, quad-scan using wire), per wire:
o Provide
(raw or “processed”) profile data (UI: scrollable if necessary)
§ Selectable
in x or y plane
§ Selectable
by wire name (if more than one) –
Data Set tabs #1-#N = wire names
§ Selectable
by fitting algorithm
§ Output
calculated parameters, including: …..
o Provide
ability to edit a single profile (UI only) – crop, remove points and
recompute beam size (Individual Wire Analysis)
· Calculate
and output Projected Energy Spread parameter - for WS04 only
o Rms
beam size divided by dispersion (model parameter)
2.3.2.7 Emittance Analysis
The following Input/Output bullets were extracted from
emittance_proc.ppt, Henrik Loos, December 13, 2005
· Input
o List
of best fit beam sizes and
standard deviations
o List
of R matrices corresponding to each measurement from online model
· Output
o Sigma
matrix at start of beamline
o Emittance
/ Twiss parameters – calculation:
- Three independent values in
sigma matrix σ1,
σ2, σ3
- Related to measured beam size σx with R-matrix by
σx2
= R112 σ1
+ 2R11R12 σ2
+ R122
- Form linear equations for
measurement i: σx,i2 = ΣkMik σk
- Find σk by least squares fit
- Emittance is ε2 = σ1 σ3 - σ22
- Twiss parameters are β = σ1/ε, α = -σ2/ε
- Standard deviations of all
parameters
- For every slice, for every
image…
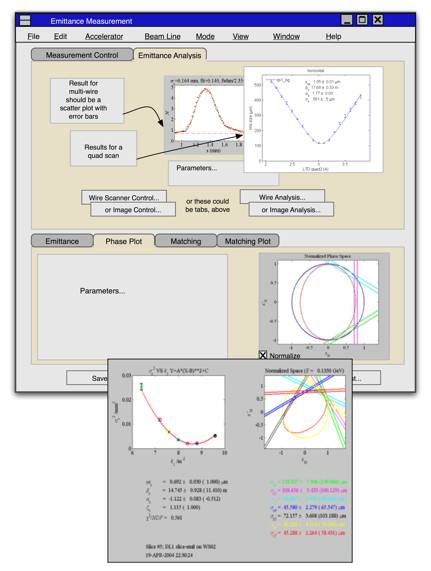
· UI -Provide scatter and phase space plots
for all measurement methods
o Details
- axis labels, when displayed data
is averaged, etc
o
· Capability
to “drill down” to either Image Analysis or Wire Analysis in order to view data
in more detail; also to modify. Any parameter recalculations as a result of
data modification at the Image or Wire Analysis layer should be able to be
easily propagated back up to the Emittance Analysis layer for emittance
recalculations.
· Save
“signature” of measurement – pointers to measurement configuration, image
data, profile data, calculated parameters for subsequent “Restore Last
Measurement” option
2.3.2.7.1 Comparison with Model : Betatron Matching
· Use
fitted emittance and machine settings from PVLogger to calculate measured beam
transfer matrices
· Use
on-line design model to compare with fitted emittance and Twiss
· Predict
changes to specified magnets to achieve design twiss parameters at specified
location
2.4 Interfaces
2.4.1 User Interface
· Allow
for UI in XAL framework
· Allow
for matlab UI
Many of the following sections contain mocked up
user-interfaces for the xal framework. These mocked-up UIs have helped to
further refine requirements.
2.4.1.1
Image Control UI
Refer to http://www.slac.stanford.edu/~zelazny/slaconly/LCLS/Image%20Analysis%20and%20Control/ ; “Image Control” for the proposed UI
for Image Control. A similar GUI for image control will be incorporated for
Emittance Measurement, either as a pop-up window or additional tab, (only when
measurement involves screens).
2.4.1.2
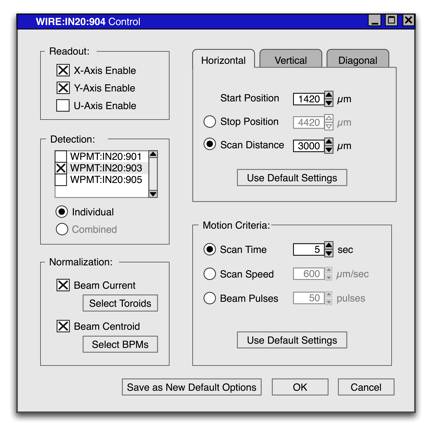
Wire scanner Control UI
Refer to the Wire Scanner Control EDD for stand-alone Wire
Scanner Control User Interface. The Wire Scanner Control GUI could be another
tab on Emittance Measurement or a separate pop-up window.
2.4.1.3
Emittance Measurement Control UI
2.4.1.3.1
Default Measurement Configuration
2.4.1.3.2
Custom Measurement Configuration
2.4.1.3.3
Multi-wire measurement
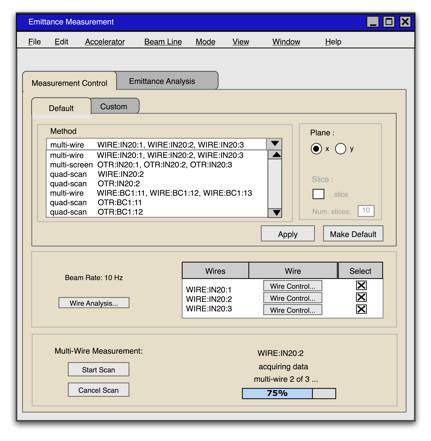
2.4.1.3.4
Multi-screen measurement
2.4.1.3.5
Quad-scan screen measurement
2.4.1.3.6
Quad-scan wire measurement
2.4.1.4
Image Analysis UI
Refer to http://www.slac.stanford.edu/~zelazny/slaconly/LCLS/Image%20Analysis%20and%20Control/ ; “Image Analysis” and “Individual
Image Analysis” .
2.4.1.5
Wire Analysis UI
Refer to http://www.slac.stanford.edu/~zelazny/slaconly/LCLS/Image%20Analysis%20and%20Control/ ; “Image Analysis” and “Individual
Image Analysis” for the Wire Analysis and Individual Wire Analysis
functionality. For wires, ignore the images in these GUIs.
2.4.1.6
Emittance Analysis UI
2.4.2 Optics model Interface
· The
Oracle database (RDB) contains the XAL accelerator definition, which consist of
accelerator sequences, devices (accelerator nodes) and associated PVs.
o The
accelerator definition is copied into an XML accelerator file via the tool
“Relocate”
o XAL
reads the XML file and generates an object graph view of the accelerator
(on-line model)
o Online
model reads the probe file’s initial conditions and generates a model specific
view of the accelerator
§ Contains R matrix values for all points along the beamline for calculating emittance / Twiss
· The Oracle database also contains design model twiss parameters for all points along the beamline for beta matching
2.4.3 Channel Access (IOCs) – these become ICDs
2.4.3.1
Timing
· Beam rate of 1Hz or 10Hz
2.4.3.1.1 Wire scanning
· Beam
synchronous data is required for relevant WIRE, PMTs, BPMs, Toroids while wire
is scanning. (Relevant magnet
setting for one wire, quad-scan)
2.4.3.1.2 Screen insertion
· Beam
enable/disable and rate limiting for screens is accomplished by MPS
2.4.3.2 Wire Scanner IOC
API forthcoming from Doug!
2.4.3.2.1 Setpoints
· Setpoints
to control selection of : plane (x, y,u), toroids, BPMs, PMTs, travel (start,
stop position or scan distance), motion (scan time or scan speed, or number of
beam pulses), normalization,
2.4.3.2.2 Readbacks
· Arrays
of raw and “processed” data for each plane (position versus beam intensity).
o Processed
data can be Current and Centroid normalized
· Fit
parameters (sigma, etc) for each plane and for each of three algorithms
· Measurement
status
2.4.3.3 YAG/OTR IOC
API forthcoming from Sheng!
2.4.3.3.1 Setpoints
· Auto-crop
on/off,
· Number
of image samples
· Number
of background image samples
· Auto
background image subtraction on/off
· screen
in/out
2.4.3.3.2 Readbacks
· Raw
image data (pixels)
· “free-running” image
· Fit
parameters (sigma, etc) for each of three algorithms
· Measurement
status
2.4.3.4
Magnet IOC
2.4.3.4.1 Setpoints
· Magnet
setting (kG-m)
2.4.3.4.2 Readbacks
· Magnet
reading (kG-m)
2.4.4
PV logger ( Oracle RDB)
Stores entire “default” machine state at time of measurement in the Oracle RDB. Part of XAL.
2.4.5 File I/O
Refer to the following figure for modeling, data, and
configuration files.
2.4.5.1 Default/Custom Emittance Measurement Configuration Files
· Ascii
text format stores:
o Measurement
type
o Diagnostic
device(s)
o Magnet
o Magnet
settings
o Plane
selection
o Slice
information
2.4.5.2 Profile Data Files
· Ascii
text format
· Matlab
format
· Png
format
2.4.5.3 Image Data Files
· Pixel
2.4.5.4 Emittance Files
Contains:
· Pointers
to emittance measurement config file
· Pointers
to profile data file
· Pointers
to image data files when screen is involved in the measurement
· Calculated
emittance parameters
2.4.5.5 Accelerator file (xml)
Generated from the RDB; contains accelerator sequences, nodes, PV names. Applications that use an online (or offline) model load this to gain access.
2.4.5.6 Probe file (xml)
Model type, beam initial conditions. Each app that loads the proble file “runs through” the accelerator file and generates its online R-matrix for each element involved in lattice transport (ie magnets, RF ).
2.5 Status/error reporting
· Elog
– message to the physics log when an invasive operation occurs
· Java
cmlog client (to be developed) such that all xal applications may output
- The event window is currently
available via the xal framework and may be used in the interim.
- The
java console window may also be used