Result of using histogram.py
Thus the interface is somewhat different from the C++ interface to the HippoDraw library.
Using HippoDraw interactively can be as simple as two lines of Python code. Below is an example session.
> python
Python 2.4 (#2, Apr 15 2005, 17:09:59)
[GCC 3.4.3] on linux2
Type "help", "copyright", "credits" or "license" for more information.
>>> import hippo
>>> app = hippo.HDApp()
>>>
Obviously, even typing these two lines for every session can get boring. Instead one can put the commands in a file and use that as initialization step for the Python session. For example, the file, canvas.py, in the testsuite directory contains
import hippo
app = hippo.HDApp()
canvas = app.canvas()
where we also show how to get a handle on the current canvas window. One can run this script from a UNIX shell or Windows command prompt like this
> python -i canvas.py
>>>
This launches the complete HippoDraw application in a separate thread with the ability to interact with it from the Python shell.
> python
Python 2.4 (#2, Apr 15 2005, 17:09:59)
[GCC 3.4.3] on linux2
Type "help", "copyright", "credits" or "license" for more information.
>>> import hippo
>>> help ( hippo )
This gives you all the built-in documentation in a pager like the UNIX more or less command which is not always convienent. However, one can get the documentation on one class by ...
> python
Python 2.4 (#2, Apr 15 2005, 17:09:59)
[GCC 3.4.3] on linux2
Type "help", "copyright", "credits" or "license" for more information.
>>> import hippo
>>> help ( hippo.HDApp )
Or even one member function like this ...
> python
Python 2.4 (#2, Apr 15 2005, 17:09:59)
[GCC 3.4.3] on linux2
Type "help", "copyright", "credits" or "license" for more information.
>>> import hippo
>>> help ( hippo.HDApp.canvas )
Another way to access the same information is to use the pydoc program that came with your Python installation (except under Windows).
> pydoc hippo
This also gives you all the built-in help in a pager. Probably the most convienent method is to generate html version of the documentation. You do this by typing ...
> pydoc -w hippo
and a hippo.html file is created in your working directory. Here is what it looks like. Not very pretty, but it is the standard ouput from pydoc. You can use this link as your documentation for HippoDraw. However, it will get updated for each release and you may be using an older version.
The following sections shows and explains some example script. See also Examples of HippoDraw use with Python for more examples
>>> import random
>>> x = []
>>> for i in range ( 10000 ) :
...     x.append ( random.gauss ( 45, 10 ) )
...
>>>
To display the data as a histogram, one can then type
>>> from hippo import Display
>>> hist = Display ( 'Histogram', ( x, ), ('Gaussian', ) )
>>> canvas.addDisplay ( hist )
>>>
The first argument to the Display function specifies the type of display to create. The second is a Python tuple of Python list objects that will be used by the display. The third argument is a Python tuple of string labels for the lists.
You can now modify the plot, for example, changing the width of the bins in two ways. From the Python shell, one can invoke a member function of the histogram object like this...
>>> hist.setBinWidth ( 'x', 2 )
>>>
But it is much easier to use Axis inspector and change it with the slider or text field.
The function created a DataSource called a ListTuple. It holds references to the Python list objects as columns. The list is not copied, just referenced. It also holds the labels of each column. Displays don't redraw themselves unless they know there's been a change, like changing the bin width. But should the contents of your Python list change, the Display wouldn't know about it. But you can force the display to redraw like this...
>>> hist.update()
>>>
The Python tuple of strings provide the data source labels, but they also giving the bindings of the displays to the data source. Some displays have binding that are optional. For the example, an "XY Plot" display had binding for the X and Y axis, and optionally, for an error on X or Y. To say which optional bindings not to use the "nil" column label is used. The we can do the following
"""
   Demonstrates making simple XY plot.

   author Paul F. Kunz <Paul_Kunz@slac.stanford.edu>
"""
#
# load the HippoDraw module
#
from load_hippo import app, canvas

from hippo import Display

# Create list of data
energy = [90.74, 91.06, 91.43, 91.50, 92.16, 92.22, 92.96, 89.24, 89.98, 90.35]
sigma  = [ 29.0, 30.0,  28.40, 28.80, 21.95, 22.90, 13.50,  4.50, 10.80, 24.20]
errors = [  5.9,  3.15,  3.0,   5.8,  7.9,   3.1,   4.6,    3.5,   4.6,   3.6]

# make a plot to test it.
xy = Display ( "XY Plot", [ energy, sigma, errors ],
               ['Energy', 'Sigma', 'nil', 'error' ] )

canvas.addDisplay ( xy )

xy.setTitle ( 'Mark II Z0 scan' )

print "An XY plot is now displayed.   You can use the Inspector dialog"
print "to modify the appearance or fit a function to it."
The "nil" string can also be use by the Data inspector as well. Note in this example, we used list of lists instead of tuple of lists. Either can be used.
Speaking of the Data Inspector, sometimes it is more convenient to give HippoDraw all the data you might want to use for displays, and use the Data Inspector to create them. To do this, one creates a DataSource manually. There are three kinds supported: ListTuple, NTuple, and NumArrayTuple. They share a common interface and differ on how they store the column data. As we've seen, the ListTuple stores references to Python list objects. The NTuple makes copies of Python list objects and stores it internally as a C++ vector of doubles. The NumArrayTuple stores references to rank 1 numarray objects. The NTuple has the feature that you can add and replace rows or columns.
Creating displays with the DataInspector doesn't preclude one from also creating them with Python. The interface is similar to what we've already seen. For example
>>> energy = [90.74, 91.06, 91.43, 91.5, 92.16, 92.22, 92.96, 89.24, 89.98 ]
>>> sigma  = [ 29.0, 30.0,  28.40, 28.8, 21.95, 22.9,  13.5,   4.5,  10.8 ]
>>> errors = [  5.9,  3.15,  3.0,   5.8,  7.9,   3.1,   4.6,   3.5,   4.6,]
>>> ntuple = NTuple () # an empty NTuple
>>> ntc = NTupleController.instance ()
>>> ntc.registerNTuple ( ntuple )
>>> ntuple.addColumn ( 'Energy', energy )
>>> ntuple.addColumn ( 'Sigma', sigma )
>>> ntuple.addColumn ( 'error', errors )

>>> xy = Display ( "XY Plot", ntuple,  ('Energy', 'Sigma', 'nil', 'error' ) )
>>> canvas.addDisplay ( xy )
>>>
Registering the ntuple with the NTupleController is necessary in order for the Data Inspector to know of their existence.
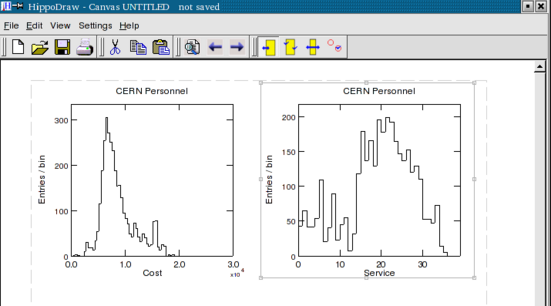
00001 """ -*- mode: python -*-
00002
00003 This script tests the creation and modification of Histogram along
00004 with some test of exception handling.
00005
00006 Copyright (C) 2001, 2003   The Board of Trustees of The Leland Stanford
00007 Junior University.  All Rights Reserved.
00008
00009 @author Paul F. Kunz <Paul_Kunz@slac.stanford.edu>
00010
00011 $Id: python_interact.html,v 1.40 2008/03/24 19:27:26 pfkeb Exp $
00012
00013 """
00014 import sys
00015 from hippo import HDApp
00016
00017 app = HDApp()
00018 canvas = app.canvas()
00019
00020 from hippo import NTupleController
00021 ntc = NTupleController.instance()
00022
00023 nt1 = ntc.createNTuple ( '../../hippodraw/examples/aptuple.tnt' )
00024
00025 from hippo import Display
00026
00027 hist = Display ("Histogram", nt1, ('Cost',) )
00028 canvas.addDisplay( hist )
00029
00030 hist.setRange ( 'x', 0., 30000. )
00031
00032 hist2 = Display ( "Histogram", nt1, ('Service',) )
00033 canvas.addDisplay ( hist2 )
00034
00035 hist2.setBinWidth ( 'x', 1.0 )
00036 hist2.setOffset ( 'x', 0.5 )
After reading a HippoDraw compatible data source file, this Python script creates two displays. It sets the range on the first and the bin width on the second. The results of running this script are shown below.
Result of using histogram.py
The Display class is actually a small wrapper around the internal HippoDraw C++ library class. It is needed because Qt is running in a separate thread from Python. Since creating a display and perhaps modifying it requires interaction with Qt's event loop, the application must be locked before calling a member function of the actual HippoDraw class and then unlocked when returning.
The file, pl_exp_test.py, in the testsuite directory shows an example of using this module.
""" -*- mode: python -*-

   Testing the PowerLaw and Exponential classes and
   exercising the hippoplotter.py wrapper.

   author: James Chiang <jchiang@slac.stanford.edu>

"""
#
# $Id: python_interact.html,v 1.40 2008/03/24 19:27:26 pfkeb Exp $
#
# Author: J. Chiang <jchiang@slac.stanford.edu>
#

from setPath import *

import random, math

import hippoplotter as plot

#
# Generate power-law and exponential distributions
#
nt1 = plot.newNTuple( ([], ), ("x", ) )
pl_display = plot.Histogram(nt1, "x", xlog=1, ylog=1,
                               title="power-law dist.")

nt2 = plot.newNTuple( ([], ), ("x", ) )
exp_display = plot.Histogram(nt2, "x", ylog=1, title="exponential dist.")

both = plot.newNTuple( ([], ), ("x",) )
combo_display =plot.Histogram(both, "x", ylog=1,
                                 title="power-law & exponential dists.")

shoot = random.uniform

#
# The parameters describing the distributions
#
x0 = 5.            # Characteristic scale for exponential

xmin = 1.          # Bounds for the power-law distribution
xmax = 100.
gamma = 2.1        # The power-law index

xpmax = math.pow(xmax, 1.-gamma)
xpmin = math.pow(xmin, 1.-gamma)

nsamp = 10000

print "Filling NTuple with data."

for i in range(nsamp):
    xi = shoot(0, 1)
    xx1 = math.pow( xi*(xpmax - xpmin) + xpmin, 1./(1.-gamma) )
    nt1.addRow( (xx1, ) )
    both.addRow( (xx1,) )

    xi = shoot(0, 1)
    xx2 = -x0*math.log(1. - xi)
    nt2.addRow( (xx2, ) )
    both.addRow( (xx2, ) )

#
# Fit these distributions
#
Function = plot.hippo.Function
powerlaw = Function( "PowerLaw", pl_display.getDataRep() )
powerlaw.addTo( pl_display )
powerlaw.fit()

exponential = Function( "Exponential", exp_display.getDataRep() )
exponential.addTo( exp_display )
exponential.fit()

#
# Do a fit to sum of functions.
#
pl = Function ( "PowerLaw", combo_display.getDataRep() )
pl.addTo( combo_display )

exp2 = Function ( "Exponential", combo_display.getDataRep() )
exp2.addTo( combo_display )

# Fit to linear sum
exp2.fit()

print "Demonstrated power law, exponential, and linear sum fitting"
print ""
The above script leads to the canvas shown below
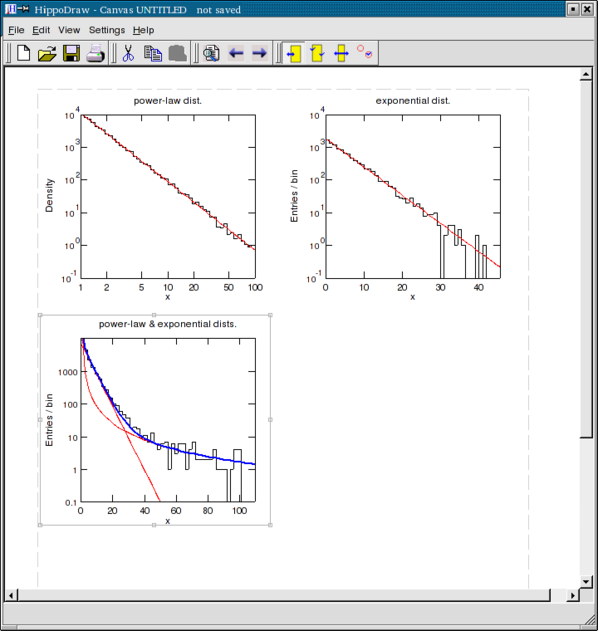
Results of pl_exp_test.py script
00001 """ -*- python -*-
00002
00003    This script adding functions and fitting.  It also demonstrates
00004    retreiving an ntuple from the histogram to do something with its
00005    contents.
00006
00007 Author: Paul_Kunz@slac.stanford.edu
00008
00009 $Id: python_interact.html,v 1.40 2008/03/24 19:27:26 pfkeb Exp $nt
00010
00011 """
00012 import sys
00013
00014
00015 from load_hippo import app, canvas
00016
00017 #
00018 # Create NTuple with its controller so Inspector can see it.
00019 #
00020 from hippo import NTupleController
00021 ntc = NTupleController.instance()
00022 #
00023 # Create full path to example file in case this script is not run from
00024 # this directory.
00025 #
00026 full_path = sys.path[0] + '/' + 'aptuple.tnt'
00027
00028 nt1 = ntc.createNTuple ( full_path )
00029
00030 canvas.setPlotMatrix ( 2, 3 )
00031 from hippo import Display
00032
00033 hist = Display ( "Histogram", nt1, ("Cost", ) )
00034 canvas.addDisplay( hist )
00035
00036 # Get the data representation so we can add function to it.
00037 datarep1 = hist.getDataRep()
00038 from hippo import Function
00039 gauss = Function ( "Gaussian", datarep1 )
00040 gauss.addTo ( hist )
00041
00042 # Get the function parameters and display them.
00043 print "Before fitting"
00044 parmnames = gauss.parmNames ( )
00045 print parmnames
00046
00047 parms = gauss.parameters ( )
00048 print parms
00049
00050 # Now do the fitting.
00051 gauss.fit ( )
00052
00053 print "After fitting"
00054 parms = gauss.parameters ( )
00055 print parms
00056
00057 # Add another function.
00058 gauss1 = Function ( "Gaussian", datarep1 )
00059 gauss1.addTo ( hist )
00060
00061 # Do another fit, should fit to linear sum
00062 gauss1.fit ()
00063
00064
00065 # Add Chi-squared per d.f. display
00066 canvas.addTextRep ( hist, 'Chi-squared' )
00067
00068 # Create an NTuple from the histogram.
00069 # Calculate the residuals
00070
00071 result = hist.createNTuple ()
00072 ntc.registerNTuple ( result )
00073
00074 coords = result.getColumn ( 'Cost' )
00075 values = result.getColumn ( 'Density' )
00076 res = []
00077 for i in range ( result.rows ) :
00078     x = coords[i]
00079     diff = values[i] - gauss1.valueAt ( x )
00080     res.append ( diff )
00081
00082 # Add a column and display it.
00083 result.addColumn ( 'residuals', res )
00084 resplot=Display ( "XY Plot", result, ( 'Cost', 'residuals', 'nil', 'Error' ) )
00085 canvas.addDisplay ( resplot )
00086
00087 print "The histogram was fitted to the sum of two gaussians."
00088 print "Then histogram bins were retrieved to calculate "
00089 print "the residuals.  These were then plotted as an XY Plot."
00090 print 'One could have used the "Create residuals display" button on the'
00091 print "Inspector, but that wouldn't have demonstrated anything."
00092
00093
Like the previous script, it fits two functions to a histogram. It also shows how to extract the function parameter names and their values. Near the end of the script, one extracts the contents of the histogram bins in the form of an NTuple. In the for loop at the end, one uses the NTuple to calculate the residuals between the function and the bin contents and put them in a Python list. The the list is added as a column to the NTuple. Finally, one creates an XYPlot to display them and adds it to the canvas. The result looks like this...
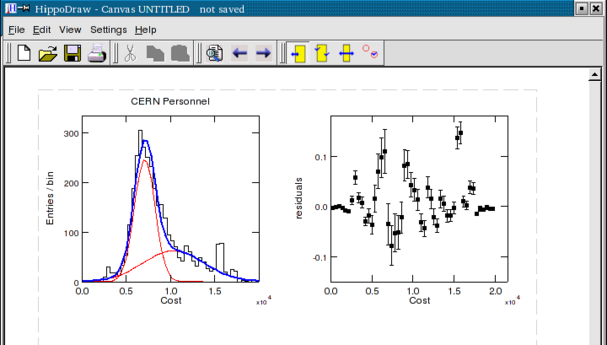
Results of function_ntuple.py
However, one didn't have to write this script to plot the residuals, as the is a control in the Function inspector that does it for you.
00001 """ -*- mode: python -*-
00002
00003    Displaying the EGRET All Sky survey
00004
00005    author: James Chiang <jchiang@slac.stanford.edu>
00006
00007 """
00008 #
00009 # $Id: python_interact.html,v 1.40 2008/03/24 19:27:26 pfkeb Exp $
00010 #
00011
00012 import sys
00013 sys.path.reverse()
00014 sys.path.append('../../hippodraw/python')
00015 sys.path.append('..//python')
00016 sys.path.reverse()
00017
00018 from setPath import *
00019
00020 import hippoplotter as plot
00021
00022 file = "../../hippodraw/examples/EGRET_AllSky.fits"
00023 plot.fitsImage(file, zlog=1, aspect=2)
The resulting canvas is shown below
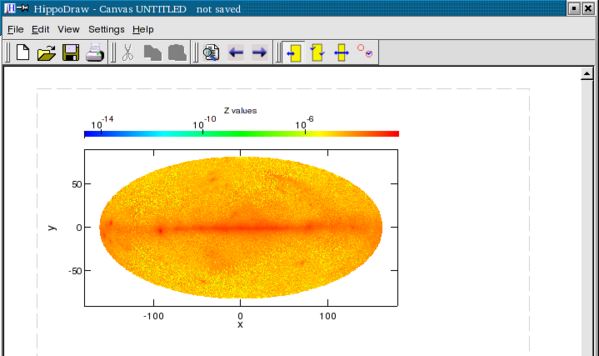
The EGRET All-Sky survey.
The FITS data format is a standard astronomical data and mandated by NASA for some projects. It supports images as well as binary or ASCII tables. A FITS table is essentially a NTuple with added information in the form of keyword-value pairs. James Chiang also wrote the following Python function to convert a FITS table to a HippoDraw NTuple.
00001 """
00002 Read in a series of FITS table files and make them accessible as
00003 numarrays, optionally creating a HippoDraw NTuple.
00004
00005 @author J. Chiang <jchiang@slac.stanford.edu>
00006 """
00007 #
00008 # $Id: python_interact.html,v 1.40 2008/03/24 19:27:26 pfkeb Exp $
00009 #
00010 import sys, pyfits
00011 try:
00012     import numarray as num
00013 except ImportError:
00014     import numpy as num
00015
00016 class FitsNTuple:
00017     def __init__(self, fitsfiles, extension=1):
00018         cat = num.concatenate
00019         #
00020         # If fitsfile is not a list or tuple of file names, assume
00021         # it's a single file name and put it into a single element
00022         # tuple.
00023         #
00024         if type(fitsfiles) != type([]) and type(fitsfiles) != type(()):
00025             fitsfiles = (fitsfiles, )
00026         #
00027         # Process each file named in the list or tuple.
00028         #
00029         columnData = {}
00030         for i, file in zip(xrange(sys.maxint), fitsfiles):
00031             #print "adding", file
00032             table = pyfits.open(file.strip(" "))
00033             if i == 0:
00034                 self.names = table[extension].columns.names
00035             for name in self.names:
00036                 if i == 0:
00037                     columnData[name] = table[extension].data.field(name)
00038                 else:
00039                     columnData[name] = cat((columnData[name],
00040                                             table[extension].data.field(name)))
00041         #
00042         # Add these columns to the internal dictionary.
00043         #
00044         self.__dict__.update(columnData)
00045
00046     def makeNTuple(self, name=None, useNumArray=1):
00047         import hippo
00048         if useNumArray:
00049             nt = hippo.NumArrayTuple()
00050         else:
00051             nt = hippo.NTuple()
00052         if name != None:
00053             nt.setTitle(name)
00054         ntc = hippo.NTupleController.instance()
00055         ntc.registerNTuple(nt)
00056         for name in self.names:
00057             if len(self.__dict__[name].shape) > 1: # have multicolumn variable
00058                 columns = self.__dict__[name]
00059                 columns.transpose()
00060                 for i, col in enumerate(columns):
00061                     colname = "%s%i" % (name, i)
00062                     nt.addColumn(colname, col)
00063             else:
00064                 try:
00065                     nt.addColumn(name, self.__dict__[name])
00066                 except TypeError:
00067                     pass
00068         return nt
00001 """ -*- mode:python -*-
00002
00003 Demo of reading ROOT file with function, cuts, and calculation
00004
00005 author: Paul F. Kunz <Paul_Kunz@slac.stanford.edu>
00006
00007 """
00008
00009 #import setPath
00010 from load_hippo import  app, canvas
00011
00012 from hippo import RootController, Display
00013 rc = RootController.instance()
00014
00015 # filename = "/nfs/farm/g/glast/u33/InstrumentAnalysis/MC/EngineeringModel-v6r070329p28/Surface_muons/surface_muons_4M_merit.root"
00016
00017 filename =  "/nfs/farm/g/glast/u41/Integration/rootData/077014364/v7r0913p11/svacTuple/v3r0p3/svacTuple-v3r9p3_077014364_svac_svac.root"
00018 ntuple_names = rc.getNTupleNames ( filename  )
00019 print "In this file, tree names are ", ntuple_names
00020
00021 ntuple = rc.createDataArray ( filename, 'Output' )
00022 print "Number of columns = ", ntuple.columns
00023
00024 labels = ntuple.getLabels()
00025 print "column labels are ... ", labels
00026
00027 print "Number of rows = ", ntuple.rows
00028
00029 xi = ntuple['AcdTkrIntSecGlobalX']
00030 print xi.shape
This script not only uses ROOT, but it also uses numarray. It converts a ROOT brach into a numarray array so it can do vector calculations. The ROOT C++ macro to do the equivalent of the above Python script would be considerable more complex.
One can view the reference documentation for the hippo extension module with Python's online help command, One can also use the pydoc program to view it or generated HTML file with the command "pydoc -w hippo".
In order to be able to have an interactive Python session that interacts with the HippoDraw canvas items and at the same time have interaction with the same items from the Inspector, it was necessary to run the HippoDraw application object in a separate thread. Threading conflicts could then occur. Thus some of HippoDraw's C++ classes are exposed to Python via a thin wrapper class which locks the Qt application object before invoking an action and unlocks it when done.
One good thing about Python is that what ever you do, Python never crashes. Thus, what ever you do with the HippoDraw extension module should not crash Python. An interactive user, however, can easily mis-type an argument to a function. For example, he could try to create a display with "ContourPlot" instead of "Contour Plot". For such errors, the C++ library throws a C++ exception. The HippoDraw extension module catches them and translates them to a Python exception. Thus, when the Python user makes an error, he will receive a message instead of crashing his session.
Another reason the wrapper classes exist is to try to present a more Python "interactive friendly" interface to the user than the raw C++ interface which was designed for the application writer. With this release, it is not clear what a more "friendly" interface should look like. Maybe the Python extension module should be closer to the C++ interface and provide Python classes to wrap them in a more friendly way like James Chiang has done. Feed back on this topic would be very welcome.