A User's Guide to the Pmw.Blt Plotting Tool

BLT Graph is a highly configurable plotting library for
2D graphs written in Tcl.
A Python interface to BLT Graph is available through a
Python megawidget called
Pmw.Blt.
The original documentation of BLT Graph was written for
Tcl programmers (see e.g. the
BLT home page or G. A. Howlett's
chapter 7 in M. Harrison (ed): Tcl/Tk Tools,
O'Reilly, 1997). The purpose of
this manual is to document the usage of BLT Graph
in a Python context.
We recommend you to
download the entire HTML document and associated
scripts for local browsing. There is also rough PostScript version of the document.

The present document is divided into three parts. The first part
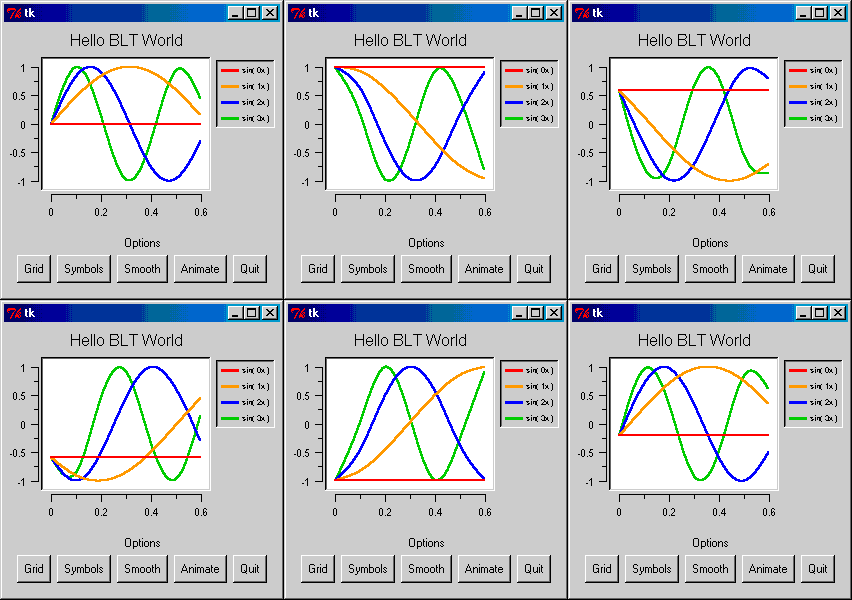
demonstrates the power of BLT Graph. If you are used to
plotting programs like Gnuplot, Matlab, or Maple, you should really take
a look at the possibilities offered by an interactive widget such as Pmw.Blt.
The second part is a tutorial were the most important features
like grids, legends, axes, colors, symbols, smoothing etc. are explained.
The third part contains
a complete reference describing all methods and arguments
available in the Python interface to BLT Graph.
Note: Pmw.Blt is aimed at programmers, that is, you
can only make graphs by writing Python statements.
This is actually the strength of Pmw.Blt; you can embed
interactive curve plotting in your own scientific applications
and tailor the plotting functionality to your specific needs.
The present guide contains numerous examples that help you get
started quickly.
Demos
The following list of Python programs are examples on Pmw.Blt used in this documentation. Some people prefer to jump directly into running codes rather than reading tutorials and manuals, so if you are one of those, have fun! You can copy the source codes from the browser into an editor, save the text in a file, and execute the file under Python (of course, this requires that you have installed Python with the Pmw and BLT packages).
| The simplest possible example (view result) | |
| A more reuseable Hello World program | |
| Demonstrates animation++ with a GUI (view result) | |
| Demonstrates how to make a user-friendly GUI (view result) | |
| Demonstrates interactive zooming (in and out) | |
| Demonstrates the use of weights (view result) | |
| Simulate the motion of a guitar string (view result) | |
| An extended version of the previous example | |
| Demonstrates all methods in the graph part | |
| Demonstrates all methods for elements (curves) | |
| Demonstrates all methods for configuring axes | |
| Demonstrates all methods for specifying a grid | |
| Demonstrates all methods related to legends | |
| Demonstrates all methods related to crosshairs | |
| Demonstrates all methods related to pens | |
| Demonstrates all methods for creating postscript | |
| Demonstrates all methods related to markers |