A Pmw.Blt appetizer
This purpose of this page is to demonstrate some of the advantages of using the Pmw.Blt widget for curve plotting. At first glance, Pmw.Blt looks like a graph-plotting library, where you create graphs by writing Python statements. However, the real strength of Pmw.Blt is that the graph appears in an interactive widget (i.e. window), which you can embed inside your scientific application, together with buttons, pull-down menus, and other elements.Suppose you have a simulation code that produces some graphs. A common way of visualizing the graphs is to store the data on file and call up some stand-alone plotting program like Gnuplot, Matlab, Excel, or Maple. There are two drawbacks with such an approach: (i) the plot appears in a separate window on the sceen, and (ii) your simulation program becomes dependent on external software (perhaps large and expensive packages). With Pmw.Blt one or more plotting windows appear exactly where you want inside the main window of your application, and there is no need to rely on big external plotting packages. The only thing users of your software need to have installed is Python, its Pmw extension, and the BLT package (this is free software available on the Internet and running on Unix/Linux, Windows, and Mac).
If you already know Python and use Pmw for GUI programming, you will only need a few minutes with this manual to make use of Pmw.Blt in an application. If you have not heard of Python, but find the promises of Pmw.Blt interesting, it is time to become familiar with this language. Python is easy to learn (regarded as much easier than, C, C++, Perl, and even Java), while the functionality is close to that of Perl, i.e., a few lines can do magic things, often requiring pages of code in C, C++ or Java.

Making a magnifier
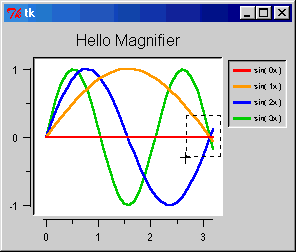
The BLT Graph package does not have any built-in support for zooming in and out of graphs. However, since Pmw.Blt is a widget that allows you to bind, e.g., mouse clicks to certain functionality in the program, it is easy to create the interactive zooming features you want. Take a look at the Hello Magnifier example to see how it can be done. On running this program, the user may click anywhere in the plotting area to drag a rectangular area. When clicking the left button, the selected area will zoom in and fill the entire plotting area. When clicking the right button, the opposite will happen: The entire plotting area will be zoomed out and placed within the marked rectangle. This functionality can be added to any graph-plotting application in less than 50 lines of code.

Using weights
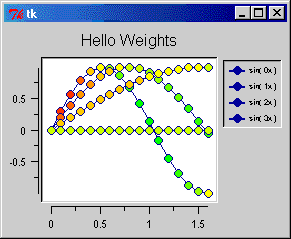
Sometimes you want to plot two graphs that are tightly related. One example is a function and its derivative. Although you can make two separate curves for the function and its derivative, Pmw.Blt allows you to add colored disks, called weights, to a curve, where the color of the disks reflect the function values of an associated curve. That is, we can plot a function and use the color of the weights to illustrate the derivative of the function. In the example to the left, some sine functions are plotted, and weights are used to visualize the derivative of each curve. The color red means high derivative, yellow means a zero derivative, and green means a negative derivative. Blt.Pmw allows you to specify the colors and symbols you want for the different ranges of the weights. In other words, way you can colorize your graphs exactly the way you like and avoid using two separate graphs it this is not natural. The current Hello weights example needs less than 25 lines of code in addition to what is needed just to draw the graph itself.

The motion of a guitar string
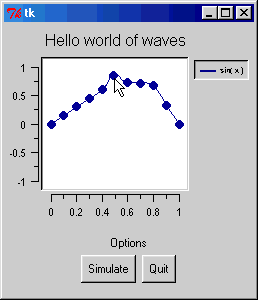
Let us turn to a more exciting example: interactive graphs and animation. Press the "Simulate" button on the picture to the right and see what happens when we simulate the motion of a guitar string (i.e. solve a wave equation numerically). This application, when run as a Python script, lets you drag each point on the graph up and down until you have built your favourite initial shape of the string. You can then press "Simulate", and the string will move. (Notice that the magnitude in y-direction is amplified in order to see what actually happens).If you look at the Hello Waves example, you will see that it takes less than 50 lines of code to include support for the animation, the ability to drag each point, and solving a wave equation for the string motion.
There is also an extended version of this Hello Waves example. The extended version has a button which sets all points on the string to zero and another button which lets you step through the animation one frame at the time. There is also a brief explanation of the mathematics behind the example.