Introduction
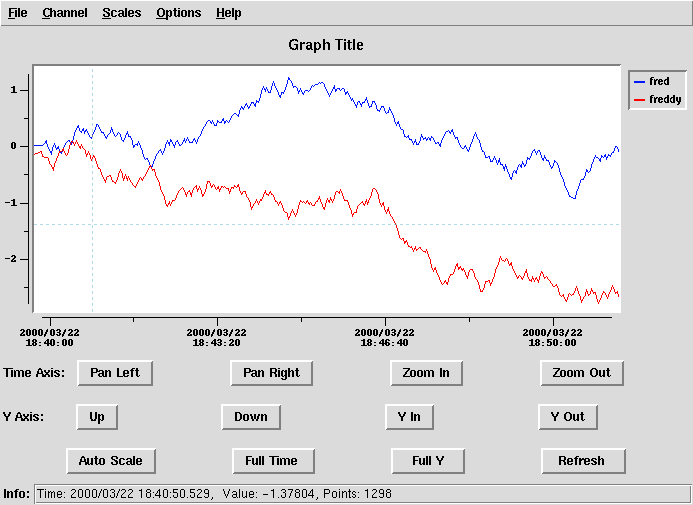
The Channel Archiver browser allows one to view time history plot data for channel
data archived by the EPICS Channel Archiver. The browser is an interactive tool
for analyzing data for selected channels during a selected time span using a specified
Y axis span. Analysis parameters such as selected channels, curve color and styles, and
Y axis span may be saved in a named configuration file for later retrieval. The time
history plot graph may be printed to a selected printer or stored in a specified Postscript
file. In addition, displayed data may be saved to a specified MATLAB file. The
Channel Archiver browser runs on UNIX platforms, obtaining data from files stored
by the EPICS Channel Archiver (which also runs on UNIX platforms).
Adding/Removing Channels
The Menu Bar contains the Channel pull-down menu containing the following two
menu items: (1) “Add Channels…”, and (2) “Remove Channels…”
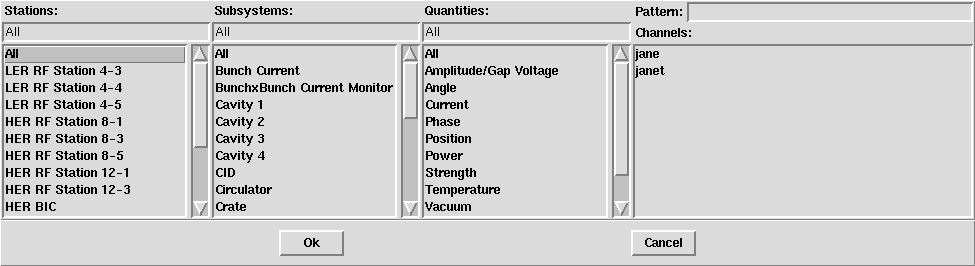
Selection of the “Add Channels…” menu item causes the display of a dialog box
allowing one to add channel curves to the graph. Initially, under the “Channels:”
label a list of channel names appears that consists of all channels archived by the
Channel Archiver that are not currently being plotted in the graph. One or more
channel names may be selected from the list using the mouse (more than one name
may be selected by holding down the “Shift” or “Ctrl” keys when selecting names
using the mouse). This list of channel names may be filtered by two different methods.
The first method is to enter a regular expression in the text box next to the “Pattern:”
label. The second filtering method is to select filtering categories from one or more
of the three filtering lists, under the “Stations:”, “Subsystems:”, and “Quantities:”
labels. Initially, the “All” category item is selected for each of the three lists,
indicating that no filtering is performed. Selecting a different category item than
the “All” category in one of the filtering lists causes the list of channel names to include
only those channels belonging to the selected category. Selecting a different category
item than the “All” category in more than one of the filtering lists causes the list of
channel names to include only those channels belonging to the intersection of all the
selected categories. For instance, selecting both the “Temperature” category item from
the Quantities filtering list and a particular station from the Stations filtering list causes
the display of only those temperature signal channels associated with the particular station.
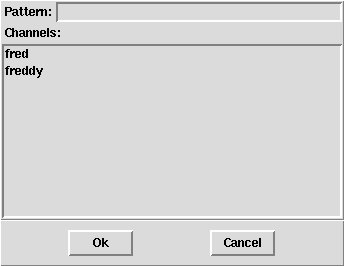
Selection of the “Remove Channels…” menu item causes the display of a dialog box
allowing one to remove channel curves from the graph. Initially, the list of channel names
that appears under the “Channels:” label consists of all channels that are currently being
plotted on the graph. The selection of one or more channel names from the list may
be made in a similar manner to that described above for adding channels. Also the
capability to filter the list using a regular expression is similar to that described above
for adding channels.
Modifying Time Span
The time span of the data being displayed may be changed in one of five ways: (1)
using the X axis buttons below the graph display (“Pan Left”, “Pan Right”, “Zoom In”,
“Zoom Out)”, (2) using the “Refresh” button below the graph display, (3) using the “Auto
Scale” or “Full Time” buttons below the graph display, (4) selecting one of the common<\p>
time spans from a pull-down menu list, or (5) through the Time Span dialog box.
The X axis buttons allow panning left or right and “zooming” in or out (i.e., moving
the time scale in or out). Panning involves shifting the time window of data shown on
the graph. Zooming involves expanding or contracting the time interval of data shown
on the graph. Panning and zooming allow the interactive analysis of data for the time
period of greatest interest to the user.
The “Refresh” button may be used to display the most current data for the channels
last plotted. It may be thought of as a single pan right to the current time.
The “Auto Scale” and “Full Time” buttons allow one to return to the default X axis
time span: the display of all previously retrieved data for the selected channels. These
buttons may be used to alter the time span to view all of the previously retrieved
archived data for the selected channels after previous modifications to the graph time
span. The “Auto Scale” button also changes the Y axis scaling in addition to modifying
the time span.
Several common time spans are provided in a pull-down menu list while selecting
the “Common Time Spans” menu item from the Scales pull-down menu on the Menu
Bar. These common time spans allow one to quickly select the latest data for the selected
channels for a time span of interest.
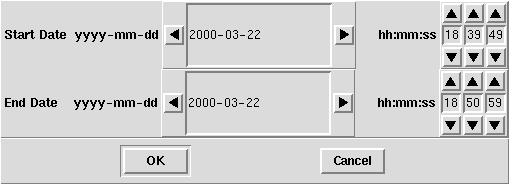
The fourth method of modifying the time span is through the Time Span dialog box,
which may brought up by selecting the “Time Span…” menu item from the Scales
pull-down menu on the Menu Bar. This dialog box allows the modification of the
start date/time and the end date/time. The date fields are in the format “yyyy-mm-dd”
(for example, 2001-02-14). A date may be modified by selecting one of the arrow
buttons on either side of the date field to move a date backwards by one day or forward
by one day with each mouse click. Alternatively, a displayed date may be modified
by entering a new date in the date text field in “yyyy-mm-dd” format. Invalid or partially
entered dates will be indicated by a pink background in the text field. The time fields
are in separate hour, minute, and second text fields. A time field may be modified by
selecting one of the arrow buttons above and below the time field to move a field back
or forward by one unit with each mouse click. Alternatively, each time field may be
modified by entering a new value in the text field.
Modifying Y Span
The Y axis scaling of the data being displayed may be changed in one of three ways:
(1) using the Y axis buttons below the graph display (“Up”, “Down”, “Y In”, and “Y Out”),
(2) using the “Auto Scale” or “Full Y” buttons below the graph display, or (3) through
the Y Span dialog box.
The Y axis buttons allow moving the Y value span up (increasing the Y maximum and
minimum span values) or down (decreasing the Y maximum and minimum span values).
These buttons also allow contracting the Y value span of the displayed data (“Y In”) and
expanding this Y value span (“Y Out”). Analogous to X axis button features, the Y axis
buttons allow the interactive analysis of data to display the area of greatest interest to
the user.
The “Auto Scale” and “Full Y” buttons allow one to scale the Y axis based on values
for all previously retrieved data for the selected channels. These buttons may be used to
conveniently rescale the Y value span based on previously retrieved data after modifications
to the Y axis scaling. The “Auto Scale” button also changes the time span in addition to
modifying the Y axis scaling.
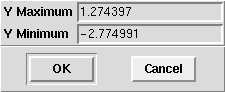
The Y axis scaling may also be modified using the Y Span dialog box, which may be
brought up by selecting the “Y Span…” menu item from the Scales pull-down menu on
the Menu Bar. This dialog box allows the modification of the Y maximum and minimum
span values by entering new values into their respective text fields. Invalid data entry
values in one of these text fields will cause the text field background color to become
pink.
Toggling Between Linear and Log Scales
The Y axis scaling may be toggled from its current state by selecting the “Log Y Axis”
menu item from the Scales pull-down menu on the Menu bar. If logarithmic scaling is
selected, Y axis scaling is provided with a Y span of one or more whole decades (powers
of ten). The Tk/Tcl package used to implement the graph scaling limits the number of
decades that may be selected for the Y span. Logarithmic scaling is not allowed for data
whose smallest value is less than or equal to zero.
Modifying the Plot Title
The plot title may be modified using the Plot Title dialog box, which may be brought
up by selecting the “Plot Title…” menu item from the Options pull-down menu on the
Menu Bar. The new plot title may be entered in the text field appearing in the dialog box.

Modifying the Curve Styles
The graph curve styles of the channels currently being plotted may be modified.
The line width of the curve for each channel being plotted may be modified and the
line may be specified as being solid or dashed. In addition, the user may indicate
whether each data point on the graph for a curve should be marked with a specified
type of symbol from a list of choices. If it is desired to mark each data point on the
graph for a curve with a symbol, the user may specify whether the symbol should be
filled or hollow.
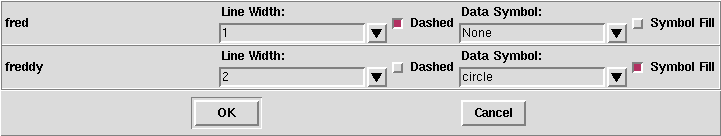
The graph curve styles of the channels currently being plotted are modified using
the Curve Styles dialog box, which may be displayed by selecting the “Curve Styles…”
menu item from the Options pull-down menu on the Menu Bar. The dialog box contains
one row of information for each channel currently being plotted describing the current
curve style parameter settings. For each channel the curve line width may be modified
by selecting a number from 1 to 5 from the pull-down list (1 represents the thinnest line
and 5 represents the thickest line). For each channel the curve may be specified as
being dashed or not by toggling the Dashed toggle button (the toggle button is gray and
appears unfilled to represent a non-dashed, solid line while a filled red toggle button
indicates that the line should be dashed). For each channel a symbol may be used to
mark each data point. The Data Symbol pull-down list may be used to indicate whether
no symbol should be used to mark each data point (the “None” selection item) or whether
a selected symbol from the list should be used to mark each data point (e.g., a square,
circle, etc.). If a symbol is selected to mark each data point for a curve, the user may
indicate whether the symbol should be filled with a solid color or be hollow by toggling
the Symbol Fill toggle button (the toggle button is gray and appears unfilled to indicate
that the data symbols marking data points should be hollow while a filled red toggle
button indicates that each symbol should be filled with color).
Showing Crosshairs
Crosshairs may or may not be shown when the cursor is placed on the graph by toggling
the “Show Crosshairs” menu item from the Options pull-down menu on the Menu bar. The
default is to show the crosshairs.
Showing Repeats
Channel Archiver points having a repeat count of 1 may or may not be shown by toggling
the “Show Repeats” menu item from the Options pull-down menu on the Menu bar. Points
having a repeat count of 1 exists for periodic sampled (not monitored) channels and have
timestamps on exact sample intervals. These points do not represent real sample points;
instead they represent “reconstructed” points returned by the Archiver data retrieval
software showing the last sampled value on an exact sample interval for recently sampled
data. Since these points are redundant values, the default behavior is to not show these points.
Showing Steps
Instead drawing straight lines between each channel's data points, steps may be
drawn by toggling the “Show Steps” menu item from the Options pull-down menu on the
Menu bar. If the “Show Steps” item is toggled on, instead of drawing a straight line from
one point to the next, a straight horizontal line is drawn from the older value to the time
of the next value and then a straight vertical line is drawn from that point up or down to
the newer value. In order to implement the steps feature, twice as many points are
plotted and half of those are dummy points.
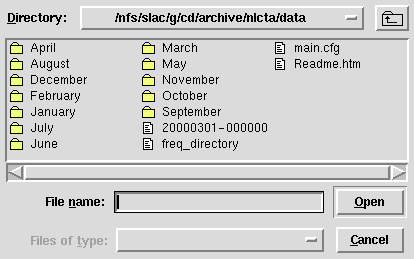
Opening an Archive
A user may select a different Channel Archive directory file from the default using
the Open Archive dialog box, which may be brought up by selecting the “Open Archive…”
menu item from the File pull-down menu on the Menu Bar. The Open Archive dialog
box allows one to navigate among directories to find the desired Channel Archive
directory file to open. A typical name for a Channel Archive directory file is
“freq_directory.” The recommended method of selecting a Channel Archive directory
file is clicking on its name inside of the dialog box with the mouse. Alternatively,
one may enter the name of an existing directory file inside the dialog box text field.
It is anticipated that most users of the Channel Archiver browser will use the default
Channel Archive directory file and will not need to open an alternative archive directory
file.
Loading a Configuration File
A previously saved configuration file may be loaded to specify graph parameters
to be used for the current graph display. Configuration file graph parameters consist
of the selected channels to be plotted, the time span, Y axis maximum and minimum
values, an indication of whether linear or logarithmic scaling should be used for the
Y axis, the plot title, the curve styles, and the curve colors. The time span loaded
is the last common time span selected at the time the configuration file was saved
(the default is the last 24 hours).
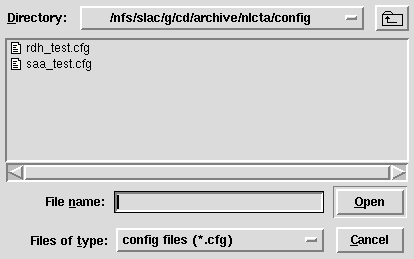
A configuration file may be loaded using the Load Configuration File dialog box,
which may be displayed by selecting the “Load…” menu item from the File pull-down
menu on the Menu Bar. The Load Configuration File dialog box allows one to navigate
among directories to find the desired configuration file to load. It is anticipated that
most configuration files will be stored in the default Channel Archiver browser
configuration file directory or subdirectories underneath it. By default only files having
the extension “cfg” are displayed in the dialog box since this extension is strongly
recommended for all Channel Archiver browser configuration files. The recommended
method of selecting a configuration file is clicking on its name inside of the dialog box
with the mouse. Alternatively, one may enter the name of an existing configuration file
inside the dialog box text field.
Saving a Configuration File
The graph parameters enumerated in the description of loading a configuration file
may be saved for the current graph. Configuration files are saved with names specified
by the user for later loading. It is strongly recommended that all configuration files
be saved with names having the extension “cfg”.
Configuration files may be saved using the Save Configuration File As dialog box,
which may be displayed by selecting the “Save As…” menu item from the File pull-down
menu on the Menu Bar. The Save Configuration File As dialog box allows one to navigate
among directories to find the desired directory in which to save a configuration file. It is
anticipated that most configuration files will be stored in the default Channel Archiver
browser configuration file directory or subdirectories underneath it. By default only files
having the extension “cfg” are displayed in the dialog box. A new configuration file may
be saved by entering its name in the dialog box text field. To reiterate, it is highly
recommended that the chosen file name end with the extension “cfg”. A user may also
overwrite an existing configuration file with the current graph parameters by selecting
the configuration file name with the mouse or entering the file name in the text box.
Upon selecting the OK button, a popup message box will appear requesting confirmation
that the specified file should be overwritten. An error message will appear indicating that
the specified existing file cannot be opened if one attempts to overwrite a file for which
write permission is not allowed (e.g., files saved by another user).
If a configuration file has been loaded or saved previously during the browser session,
the last configuration file loaded or saved previously may be overwritten with the current
graph parameters by selecting the “Save” menu item from the File pull-down menu on the
Menu Bar.

Printing a Graph Image
PostScript output describing the image of the current graph may be output to a printer
immediately or saved in a specified file for later printing. The PostScript output specifies
color information so that the graph colors will appear when printed on a color printer.
It is recommended that curve styles be specified to differentiate the plot curves when
printing the graph image to a non-color printer.
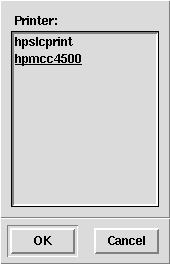
The current graph image may be output to a printer using the Printer Selection dialog
box, which may be displayed by selecting the “Print To Printer…” menu item from the
File pull-down menu on the Menu Bar. The desired output printer may be selected from
the specified list. The underlined list item is the default printer if no printer is explicitly
selected. The default printer will be the last printer name selected if a printer name was
previously selected during the current browser session. As an alternative to selecting a
printer name from the list, a desired printer may be entered in the text box above the list.
The current graph image may be output to a selected file for later printing using the
Print To File dialog box, which may be brought up by selecting the “Print To File…”
menu item from the File pull-down menu on the Menu Bar. The Print To File dialog box
allows one to navigate among directories to find the desired directory in which to save a
postscript file describing the current graph image. It is anticipated that most postscript files
will be stored in the default Channel Archiver browser postscript file directory or
subdirectories underneath it. By default only files having the extension “ps” are displayed
in the dialog box. A new postscript file may be saved by entering its name in the dialog
box text field. It is recommended that the chosen file name end with the extension “ps.”
A user may also overwrite an existing postscript file by selecting the postscript file name
with the mouse or entering the file name in the text box. Upon selecting the OK button,
a popup message box will appear requesting confirmation that the specified file should
be overwritten. An error message will appear indicating that the specified existing file
cannot be opened if one attempts to overwrite a file for which write permission is not
allowed (e.g., files saved by another user).

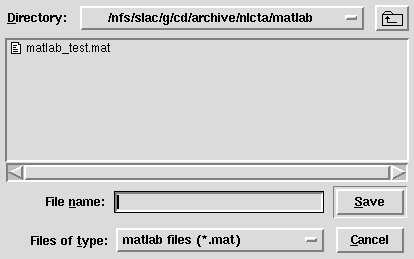
Saving Matlab File Information
Information for the current time span and channels being plotted may be saved in a
Matlab file for later analysis by using the Save Matlab File As dialog box, which may
be displayed by selecting the “Save Matlab As…” menu item from the File pull-down
menu on the Menu Bar. The Save Matlab File As dialog box allows one to navigate
among directories to find the desired directory in which to save a Matlab file describing
the current graph data. It is anticipated that most Matlab files will be stored in the default
Channel Archiver browser Matlab file directory or subdirectories underneath it. By
default only files having the extension “mat” are displayed in the dialog box. A new
Matlab file may be saved by entering its name in the dialog box text field. It is
recommended that the chosen file name end with the extension “mat.” A user may also
overwrite an existing Matlab file by selecting the Matlab file name with the mouse or
entering the file name in the text box. Upon selecting the OK button, a popup message
box will appear requesting confirmation that the specified file should be overwritten.
An error message will appear indicating that the specified existing file cannot be opened
if one attempts to overwrite a file for which write permission is not allowed (e.g., files
saved by another user).
Exiting the Channel Archiver Browser
A user may exit from the Channel Archiver browser by selecting the “Exit” menu
Item from the File pull-down menu on the Menu Bar.