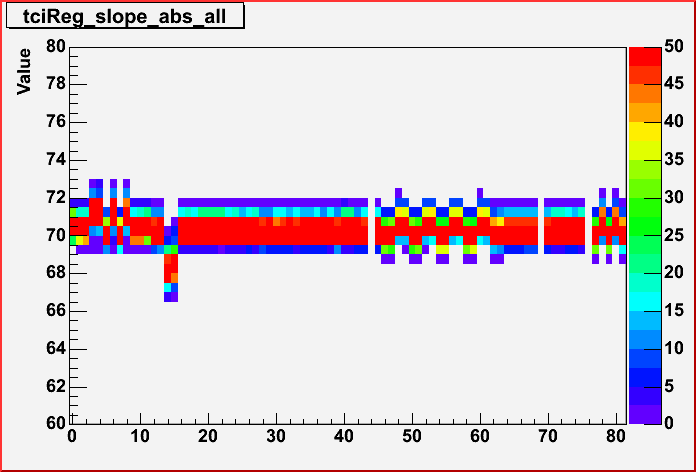
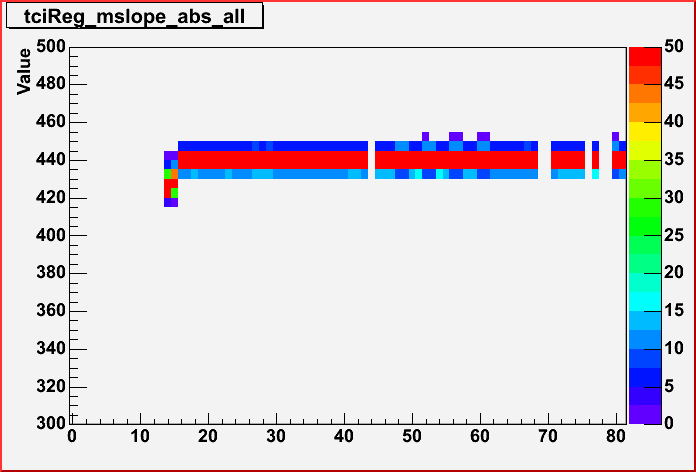
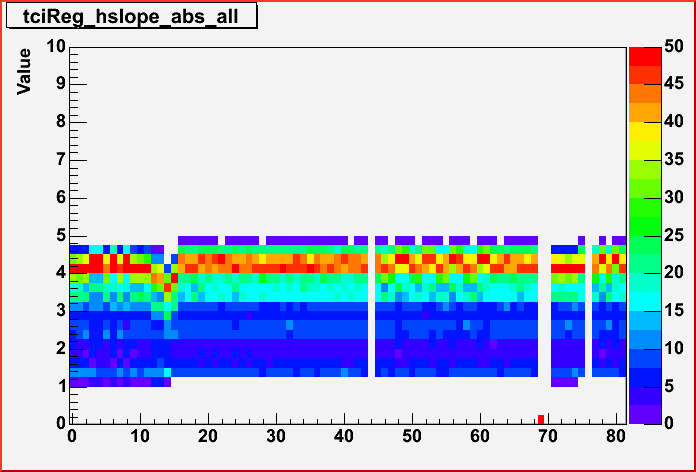
Plot of values
Comments
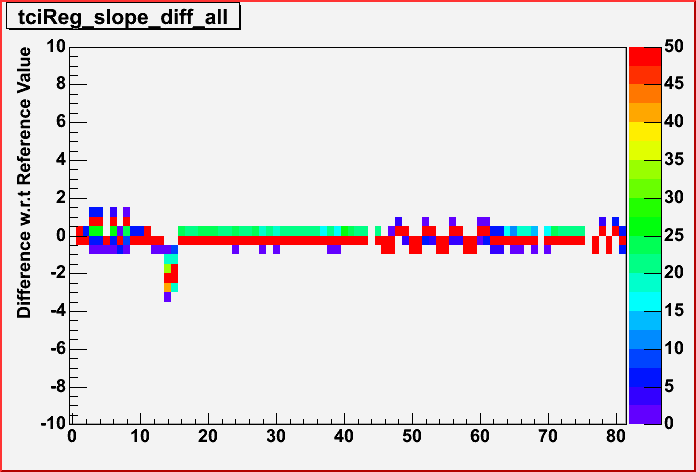
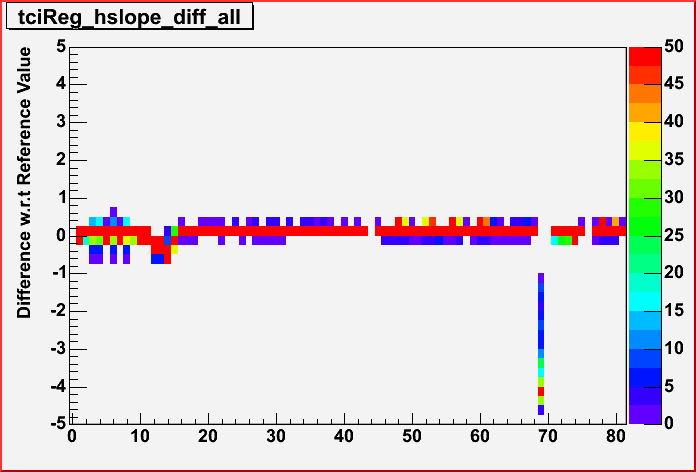
Plot of diff W.R.T. reference

This plots is for reg range readout
For tci_dac 0-23
Range: 0 - 2000

This plots is for reg range readout
For tci_dac 0-23
Range: -150 - -110

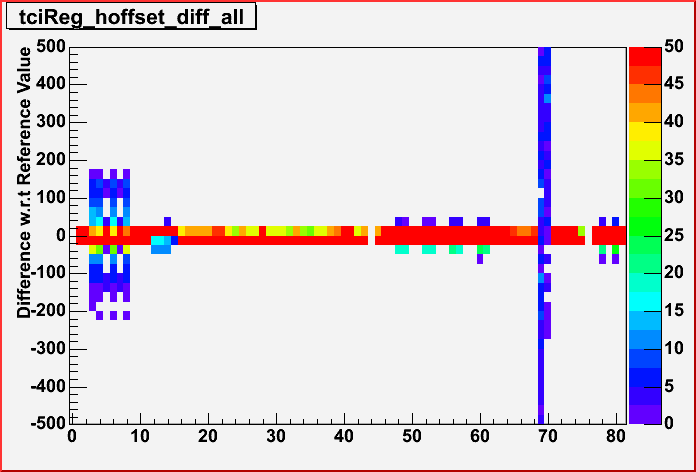
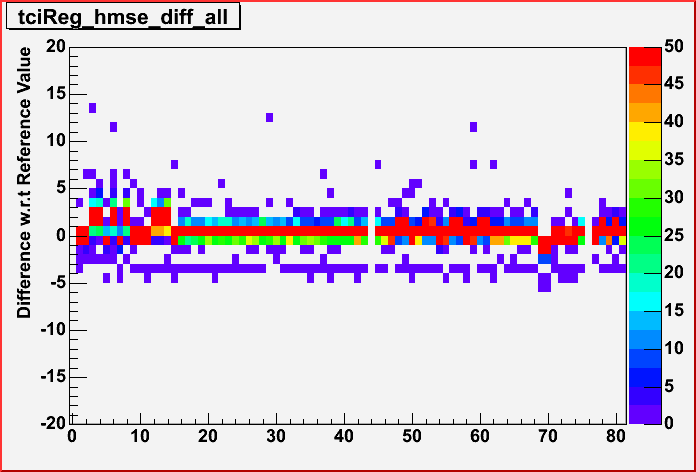
This plots is for reg range readout
For tci_dac 0-23
Range:
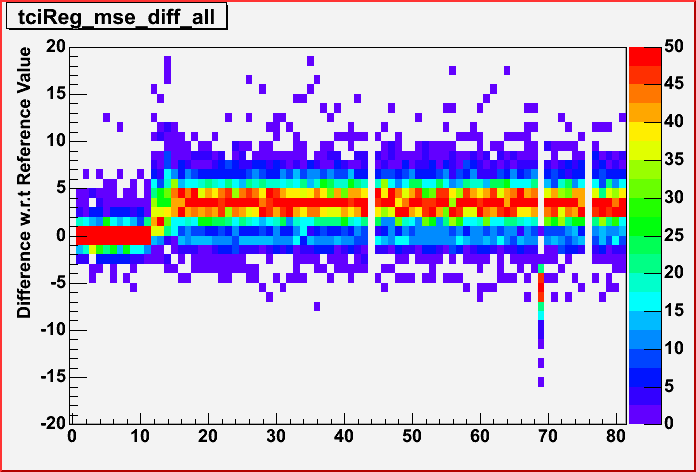

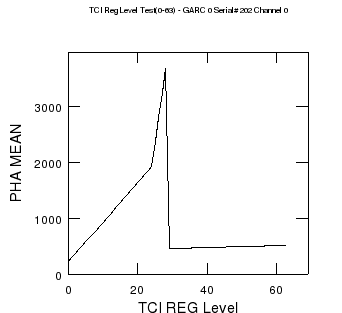
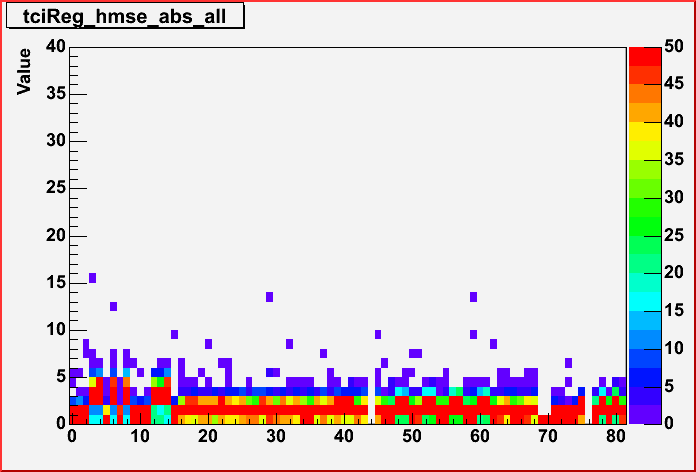
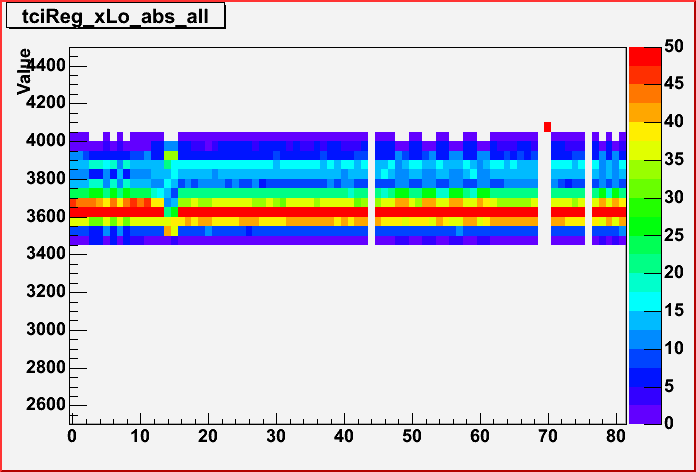
This plots is for reg range readout
For tci_dac 23-x
Range: 300-500
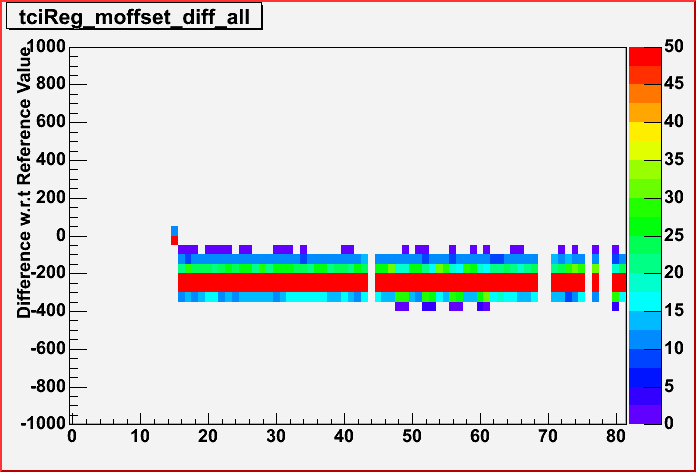
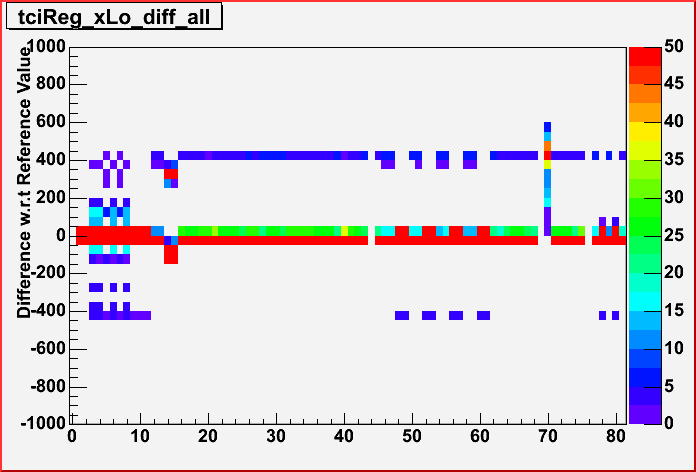
This plots is for reg range readout
For tci_dac 23-x
Range: -9500 - -7500
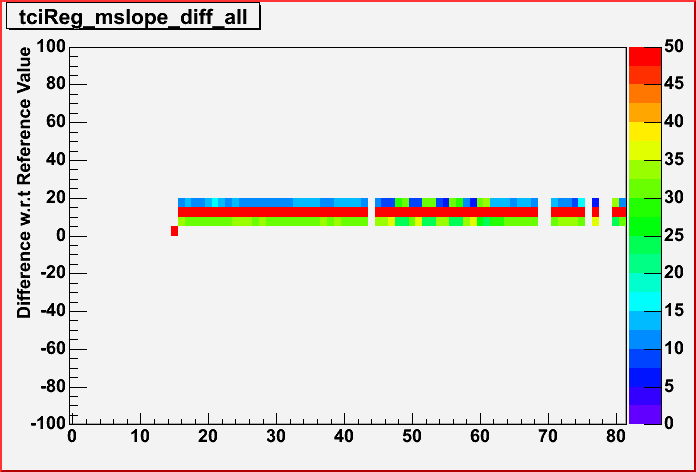

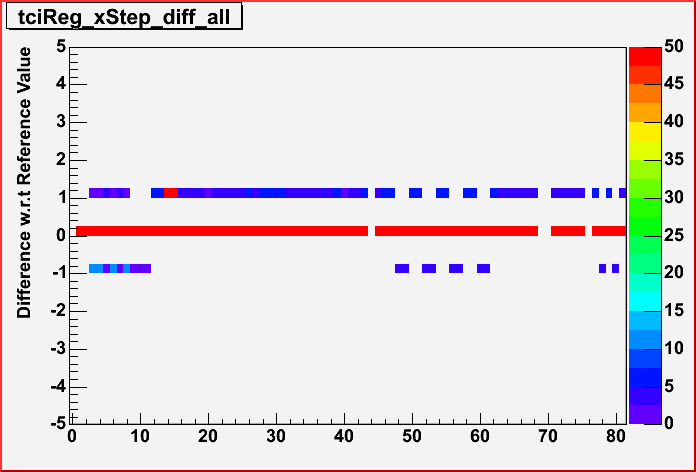
This plots is for reg range readout
For tci_dac x-63
Range: 0 - 2000
This plots is for reg range readout
For tci_dac x-63
Range: -150 - -110
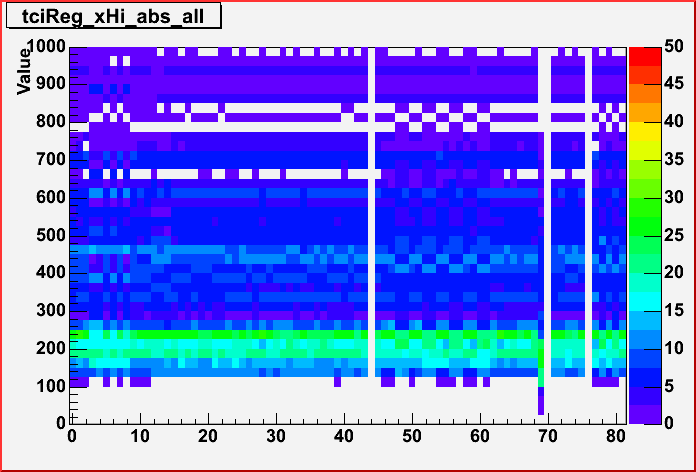
This plots is for high range readout
For tci_dac x-63
Range:
Range:
Range:

Range: