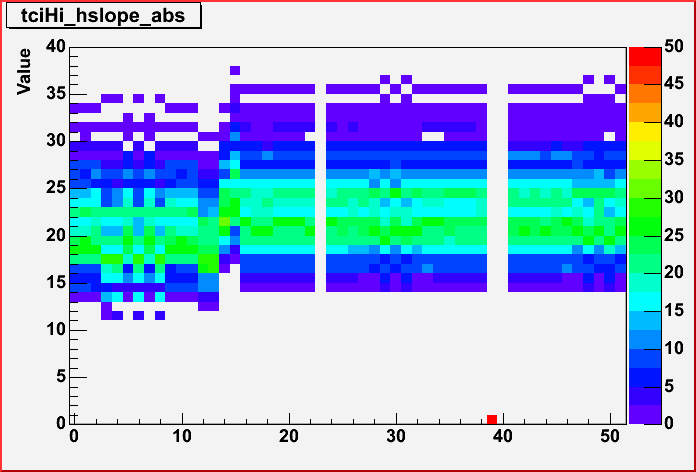
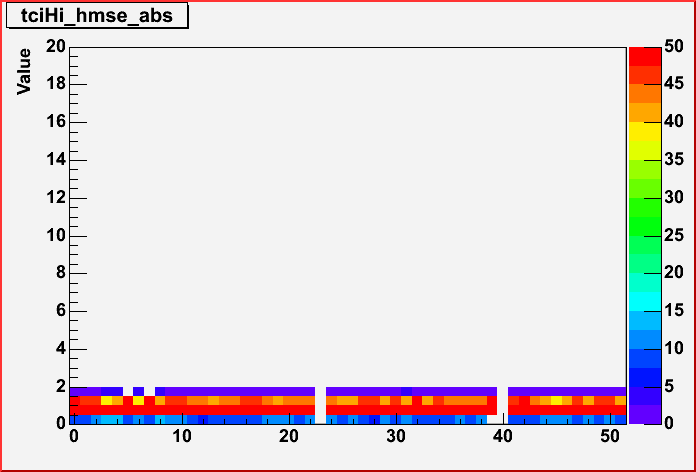
ACD Trending from AcdTciHiRange runs

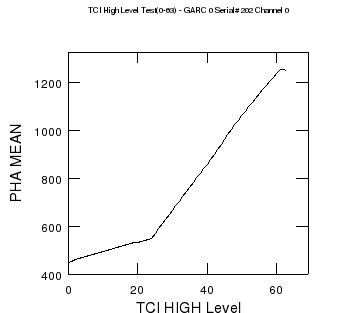
The AcdTciHighRange script pulses the charge injection strobe in increasing values of tci_dac and mesures the pha values.
Analysis of the data are complicated by the fact both the tci_dac functions in two ranges.
From 0-23 tci_dac counts the step size is much smaller than from 23-63 tci_dac counts.
To take this into account we fit two zone separetly. The test points here are the "CPT" tests list in the full list of ACD test phases


Comments:


Plot of values

Comments

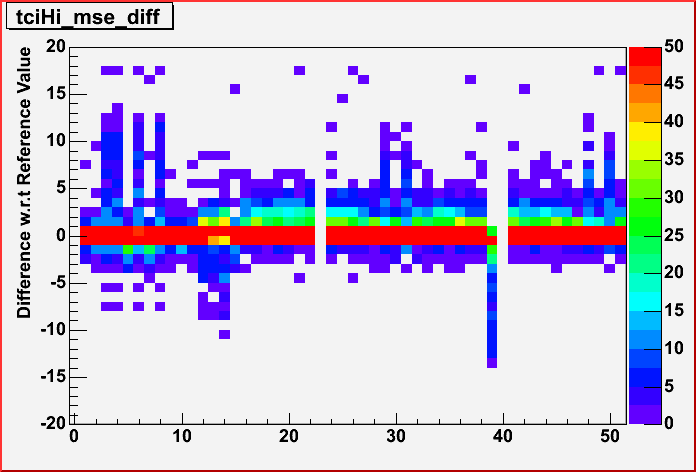
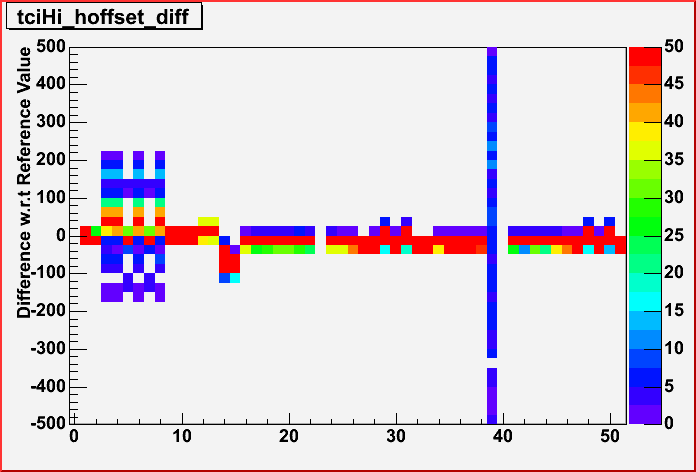
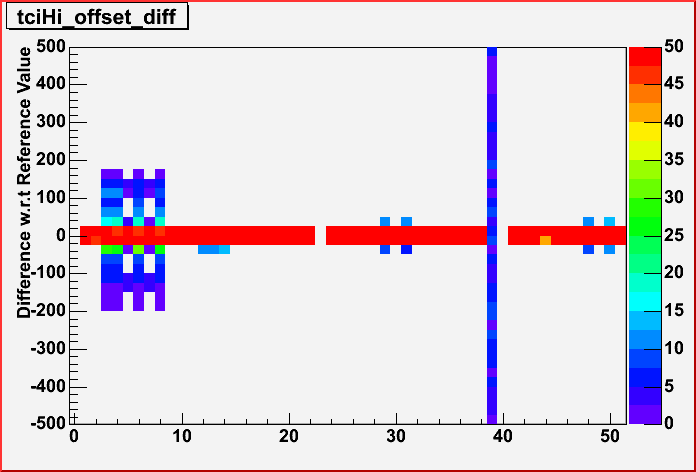
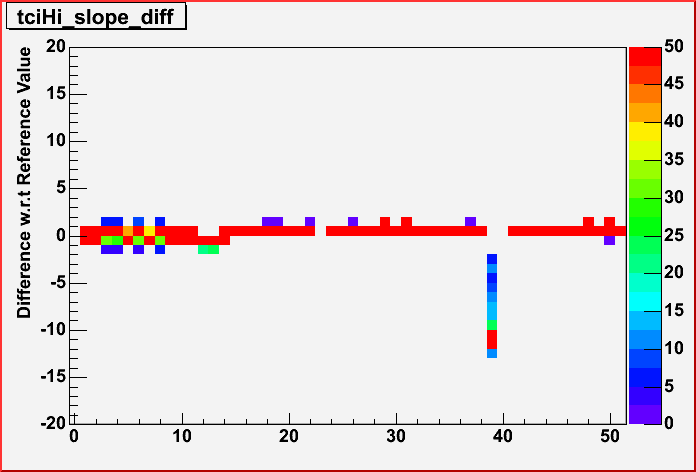
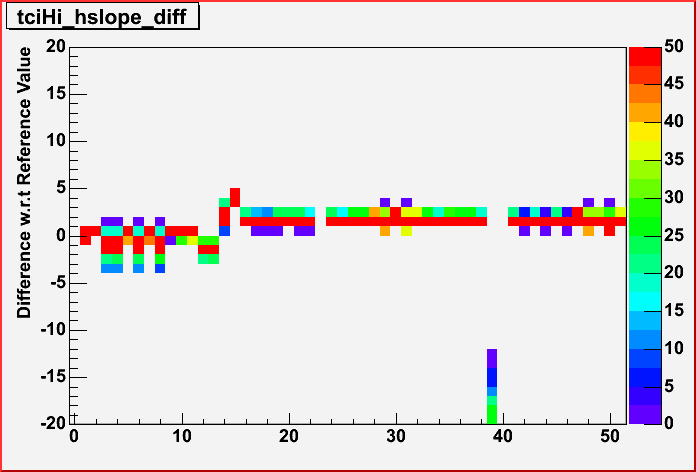
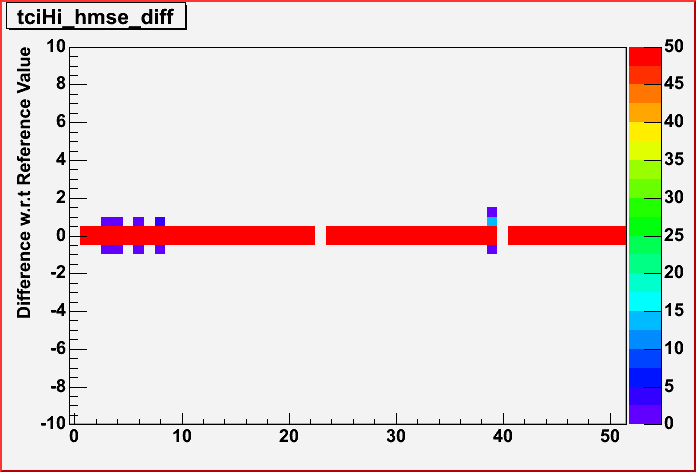
Plot of diff W.R.T. reference
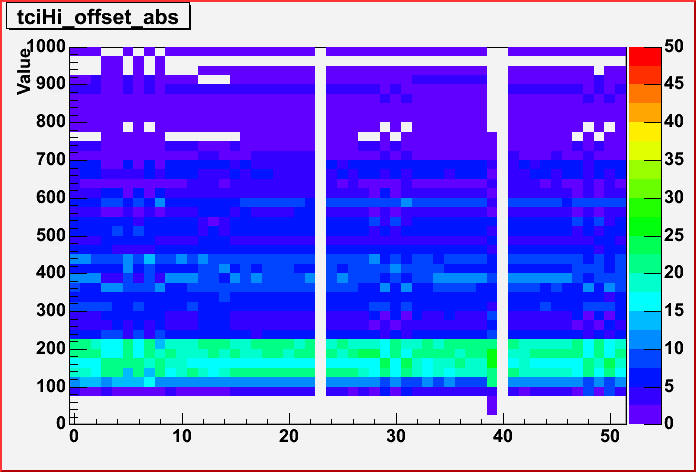
Intercept of pha v. tci_dac curve.
This plots is for reg range readout
For tci_dac 0-23
Range: 0 - 2000
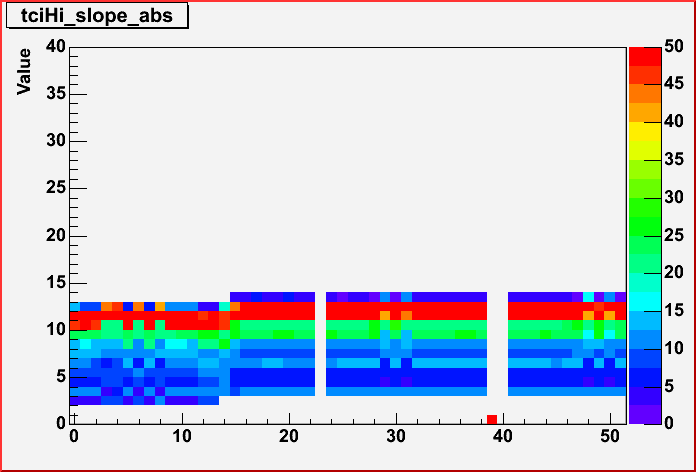
Slope of pha v. tci_dac curve.
This plots is for reg range readout
For tci_dac 0-23
Range: -150 - -110
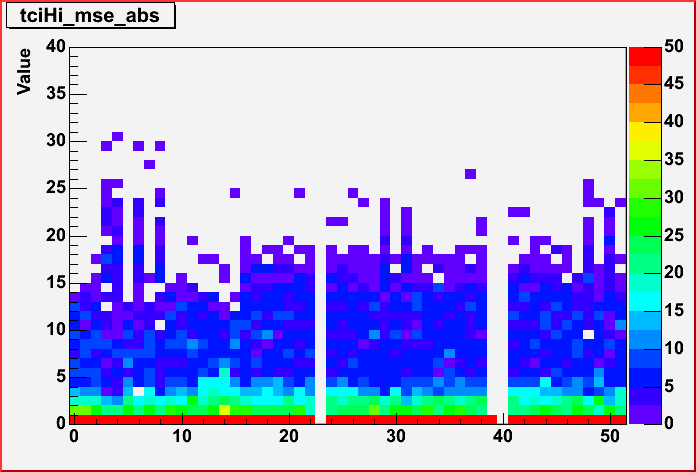
MSE of pha v. tci_dac curve.
For tci_dac 0-23
Range:
Intercept of pha v. tci_dac curve.
For tci_dac 23-63
Range: 0 - 2000
Slope of pha v. tci_dac curve.
This plots is for reg range readout
For tci_dac 23-63
Range: -150 - -110
MSE of pha v. tci_dac curve.
This plots is for high range readout
For tci_dac 23-63
Range:
Eric Charles
Last modified: Thu Oct 12 17:59:15 PDT 2006