ACD Trending from AcdLeHeBias runs

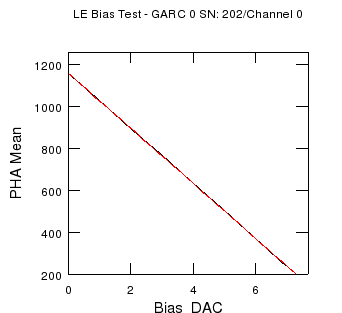
The AcdLeBiasCal script pulses the scans the bias_dac and measures the pedestal at each point
We do this for both the low range and high range readouts.
For each readout we measure the following values. Since we only have one bias_dac for both the low and high ranges the final set point is the lower of the set point for the two ranges.
The test points here are the "CPT" tests list in the full list of ACD test phases


Comments:


Plot of values

Comments

Plot of diff W.R.T. reference
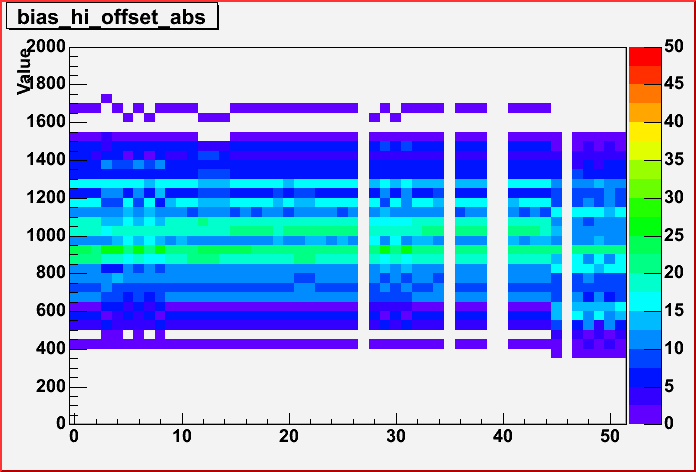
Intercept of pedestal v. bias_dac curve.
This plots is for high range readout
Range: 0 - 2000
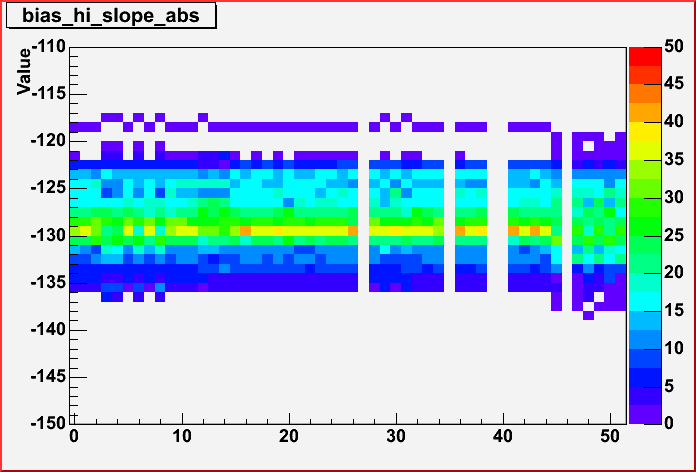
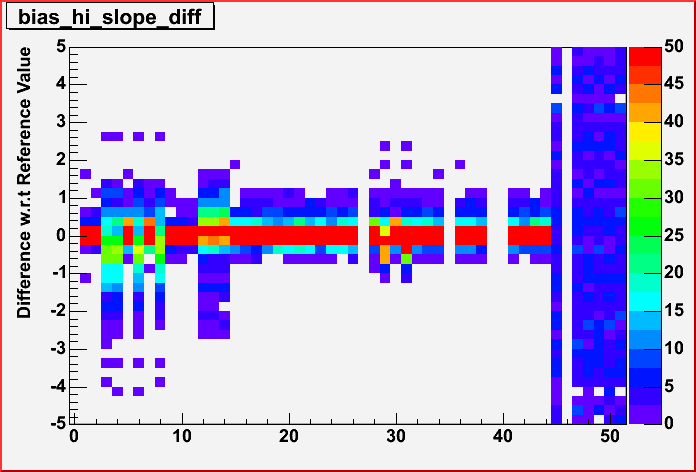
Slope of pedestal v. bias_dac curve.
This plots is for high range readout
Range: -150 - -110
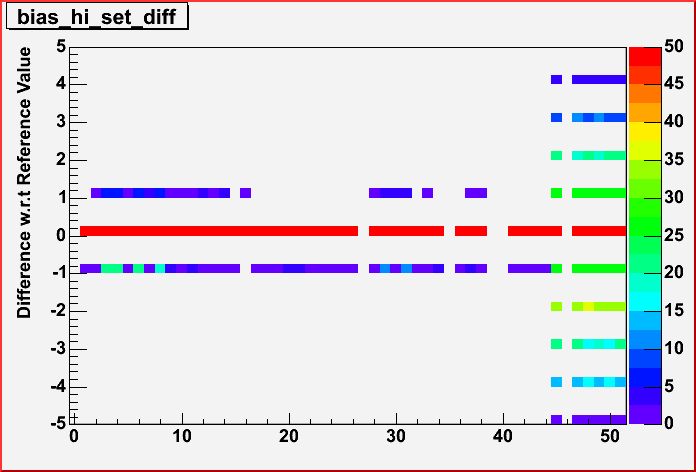
Mininum bias_dac which gives pedestal
100 pha counts
This plots is for high range readout
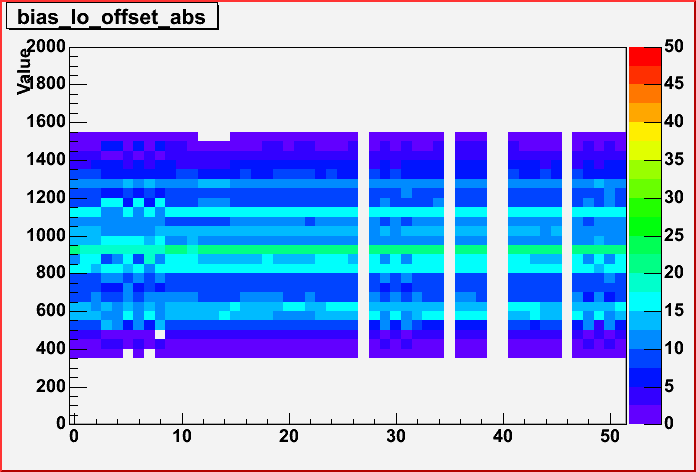
Intercept of pedestal v. bias_dac curve.
This plots is for low range readout
Range: 0 - 2000
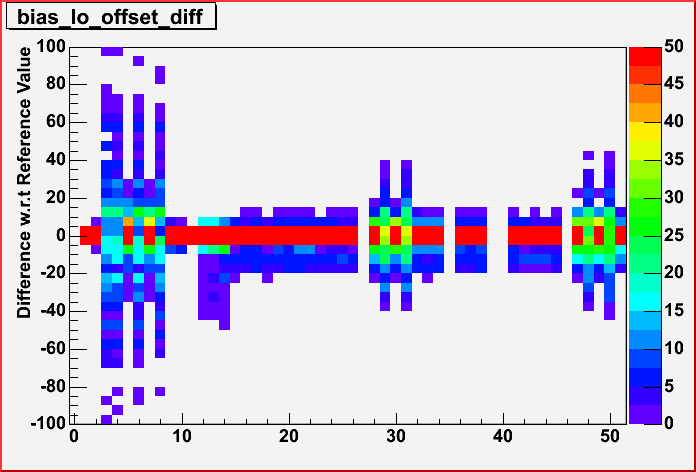
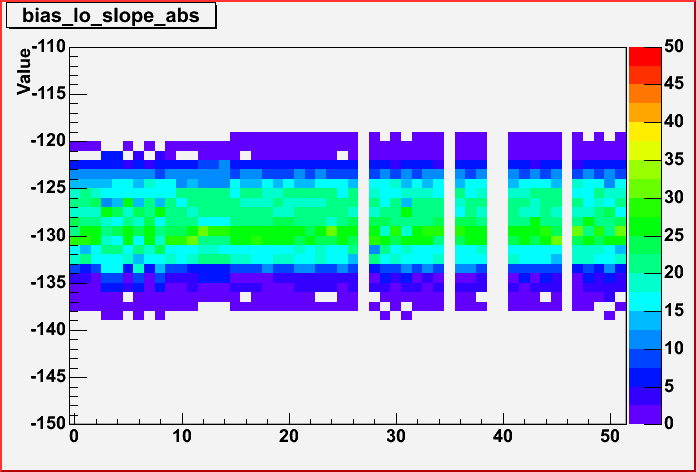
Slope of pedestal v. bias_dac curve.
This plots is for low range readout
Range: -150 - -110
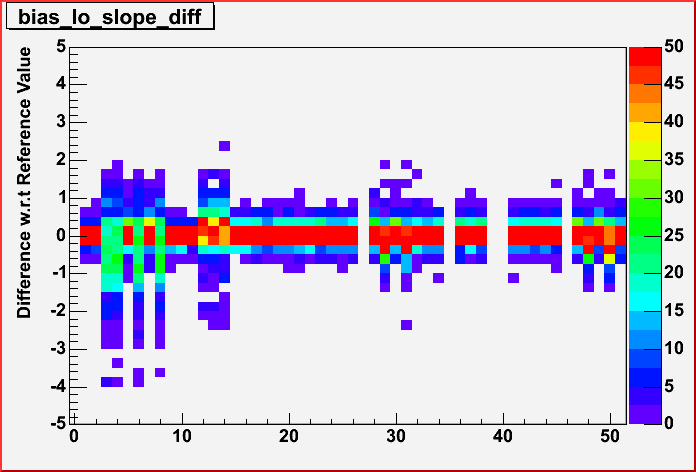
Mininum bias_dac which gives pedestal
100 pha counts
This plots is for low range readout
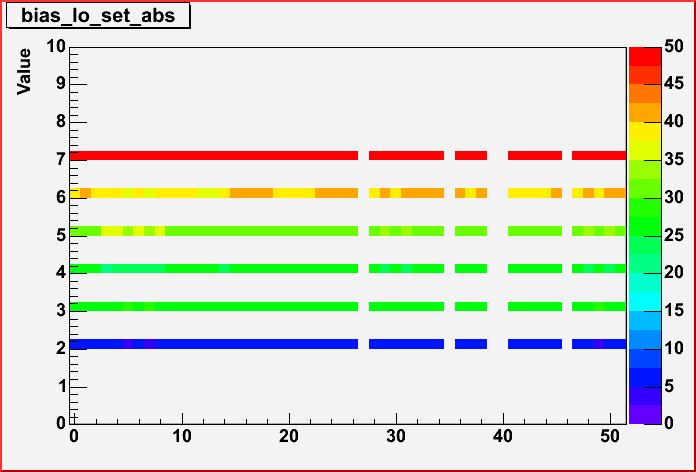
Mininum bias_dac which gives pedestal
100 pha counts for both ranges.

Eric Charles
Last modified: Thu Oct 12 17:47:12 PDT 2006