 |
 |
 |
 |
 |
ViPER (Visualization for PingER) is suite of applications being developed by the MAGGIE-NS team from the National University of Sciences and Technology (NUST) Institute of Information Technology (NIIT) and the Stanford Linear Accelerator Center (SLAC) Internet End-to-end Performance Monitoring (IEPM) project. Monitoring information is of great value to scientists, network engineers and researchers. There is a need for the presentation of monitoring information in a pervasive manner. This would help scientists in carrying out analysis on monitoring information in order to make their networks more efficient. What is PingER PingER (Ping End-to-end Reporting) is the name given to the Internet End-to-end Performance Measurement (IEPM) project to monitor end-to-end performance of Internet links, developed by the IEPM group at the Stanford Linear Accelerator Center. The network performance of more than 300 hosts are monitored worldwide. Enjoy PingER! 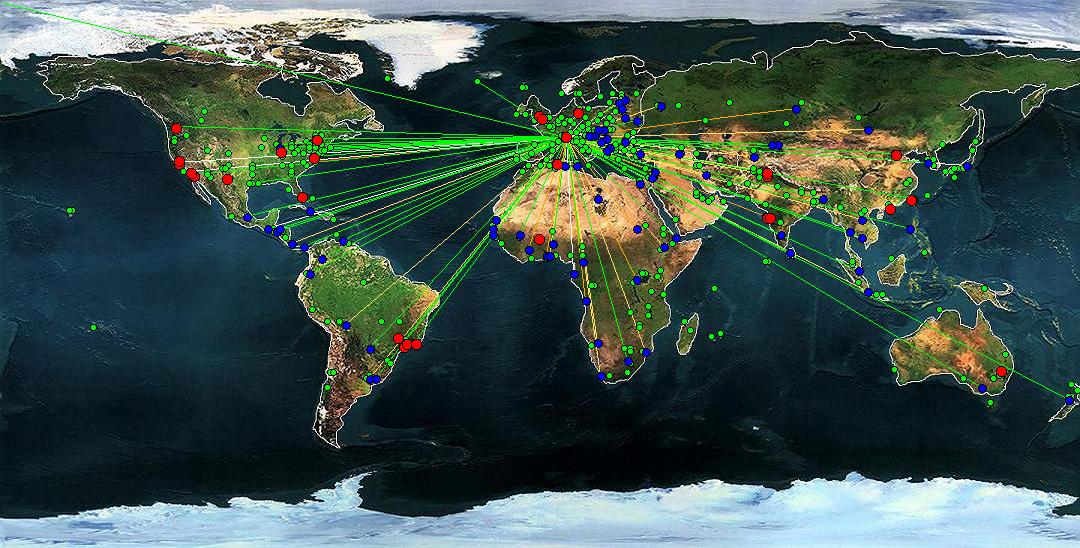 Launch PingER JNLP Client (ViPER)
ViPER (Visualization for PingER) is an interactive Java application being developed by the MAGGIE-NS team from the National University of Sciences and Technology (NUST) Institute of Information Technology (NIIT) and the Stanford Linear Accelerator Center (SLAC) Internet End-to-end Performance Monitoring (IEPM) project. ViPER's purpose is to visually present the location of all the PingER nodes on the world map, show links between PingER Monitoring and Remote nodes and provide visual representation of all the data monitored by PingER. 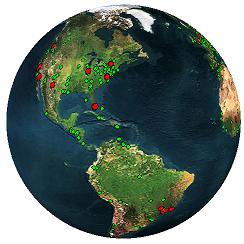 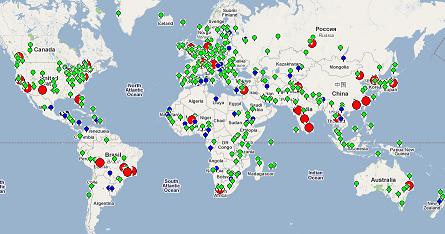 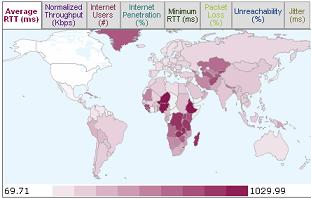 PingER Metrices Intensity Maps
The PingER Metrics Intensity Mapsare intensity maps of the Internet performance as measured by PingER. Having gathered data since 1998, the charts enable the users to study the trends and significant improvements as well as degradations. The different sets of charts (w.r.t. regions) enables the users to study the progress made by countries in comparison to their neighbours as well as the world in general. 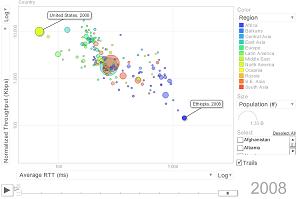 PingER Metrices Motion Charts
The PingER metrics motion charts are primarily used to visualize the trends in the Internet end-to-end performance statistics measured to over 600 countries from the 40+ PingER monitoring nodes spread worldwide. Having gathered data since 1998, the charts enable the users to study the trends, step changes, significant improvements/degradations with the help of these 4-dimensional charts. The different sets of charts (w.r.t. regions) enables the users to study the progress made by countries in comparison to their neighbors as well as the world in general.  |