|
|
Comparisons of various ping "Jitter" measures Yee-Ting Li, Chin Guok and Les Cottrell Last Update: January 12, 2006 Central Computer Access | Computer Networking | Internet Monitoring | Tutorial on ping Internet monitoring |
|
The congestion was produced by sending IPerf packets between two Linux boxes (nersc-pt1.es.net and nersc-pt2.es.net), looping the packets on the snv2-sdn1.es.net - snv-cr1.es.net link 20 times. This allowed us to congest the 10GE link using only ~500Mbps of traffic.
In our backbone we have four queues, only three of which carry user traffic (the 4th one is reserved for network control packets). The three user queues are: scavenger-service (SS), best-effort (BE), and expedited-forwarding (EF).
Baseline traffic on the snv2-sdn1.es.net -> snv-cr1.es.net link at the time of the test showed ~21.7Mbps of BE, and ~1.4Mbps of SS.
The BE circuit (LSP) was remapped for scavenger-service (over the congested link) so that it had the highest chance of being affected/dropped by the congesting cross traffic. Multiple TCP streams were run in parallel between the Linux boxes in both BE and SS classes, filling the 10GE link.
The routes through the network were:
Scavenger Service Route through ESnet
[ytl@iepm-resp:~]$ traceroute rftpexp.rhic.bnl.gov -t 32
traceroute: Warning: rftpexp.rhic.bnl.gov has multiple addresses; using 130.199.80.6
traceroute to rftpexp.rhic.bnl.gov (130.199.80.6), 30 hops max, 38 byte packets
 1  rtr-gsr-test (134.79.243.1)  0.271 ms  0.194 ms  0.186 ms
 2  rtr-core1-p2p-test (134.79.252.5)  0.208 ms  0.167 ms  0.162 ms
 3  rtr-dmz1-ger (134.79.135.15)  0.232 ms  0.206 ms  0.217 ms
 4  slac-rt4.es.net (192.68.191.146)  0.293 ms  0.355 ms  0.271 ms
 5  slacmr1-slacrt4.es.net (134.55.209.93)  0.378 ms  0.309 ms  0.236 ms
 6  snv2mr1-slacmr1.es.net (134.55.217.2)  0.658 ms  0.645 ms  0.676 ms
 7  snv1mr1-snv2mr1.es.net (134.55.217.5)  0.732 ms (TOS=0!)  0.676 ms  0.729 ms
 8  snvcr1-snv1mr1.es.net (134.55.218.21)  0.765 ms  0.682 ms  0.711 ms
 9  chicr1-oc192-snvcr1.es.net (134.55.209.54)  48.822 ms  48.801 ms  48.855 ms
10  aoacr1-oc192-chicr1.es.net (134.55.209.58)  68.904 ms  68.822 ms  68.866 ms
11  bnl-oc48-aoacr1.es.net (134.55.209.130)  70.706 ms  70.589 ms  70.643 ms
12  bnl-esbnl.es.net (198.124.216.114)  70.675 ms  70.712 ms  70.656 ms
13  * * *
14  * * *
15  * * *
16  * * *
17  * * *
18  * * *
Best Effort Path through ESnet
[ytl@iepm-resp:~]$ traceroute rftpexp.rhic.bnl.gov
traceroute: Warning: rftpexp.rhic.bnl.gov has multiple addresses; using 130.199.80.6
traceroute to rftpexp.rhic.bnl.gov (130.199.80.6), 30 hops max, 38 byte packets
 1  rtr-gsr-test (134.79.243.1)  0.243 ms  0.184 ms  0.179 ms
 2  rtr-core1-p2p-test (134.79.252.5)  0.188 ms  0.161 ms  0.158 ms
 3  rtr-dmz1-ger (134.79.135.15)  0.222 ms  0.200 ms  0.202 ms
 4  slac-rt4.es.net (192.68.191.146)  0.299 ms  0.427 ms  0.275 ms
 5  slacmr1-slacrt4.es.net (134.55.209.93)  70.653 ms  70.528 ms  70.548 ms
     MPLS Label=17 CoS=0 TTL=1 S=0
 6  snv2mr1-slacmr1.es.net (134.55.217.2)  85.679 ms  208.180 ms  221.443 ms
     MPLS Label=278 CoS=0 TTL=1 S=0
 7  snv2sdn1-snv2mr1.es.net (134.55.207.37)  0.795 ms  0.777 ms  0.743 ms
     MPLS Label=107616 CoS=0 TTL=1 S=0
 8  snvcr1-snv2sdn1.es.net (134.55.217.9)  0.843 ms  0.804 ms  0.991 ms
     MPLS Label=174544 CoS=0 TTL=1 S=0
 9  chicr1-oc192-snvcr1.es.net (134.55.209.54)  48.951 ms  48.926 ms  48.990 ms
     MPLS Label=129232 CoS=0 TTL=1 S=0
10  aoacr1-oc192-chicr1.es.net (134.55.209.58)  68.767 ms  68.762 ms  68.804 ms
11  bnl-oc48-aoacr1.es.net (134.55.209.130)  70.738 ms  70.602 ms  70.592 ms
12  bnl-esbnl.es.net (198.124.216.114)  70.616 ms  70.580 ms  70.594 ms
13  * *
EF Route through ESnet
[ytl@iepm-resp:~]$ traceroute rftpexp.rhic.bnl.gov -t 184
traceroute: Warning: rftpexp.rhic.bnl.gov has multiple addresses; using 130.199.80.6
traceroute to rftpexp.rhic.bnl.gov (130.199.80.6), 30 hops max, 38 byte packets
 1  rtr-gsr-test (134.79.243.1)  0.213 ms  0.185 ms  0.177 ms
 2  rtr-core1-p2p-test (134.79.252.5)  0.286 ms  0.173 ms  0.161 ms
 3  rtr-dmz1-ger (134.79.135.15)  0.213 ms  0.213 ms  0.195 ms
 4  slac-rt4.es.net (192.68.191.146)  0.305 ms  0.255 ms  0.319 ms
 5  slacmr1-slacrt4.es.net (134.55.209.93)  70.631 ms  70.556 ms  70.531 ms
     MPLS Label=16 CoS=0 TTL=1 S=0
 6  snv2mr1-slacmr1.es.net (134.55.217.2)  70.727 ms  70.573 ms  70.558 ms
     MPLS Label=177 CoS=0 TTL=1 S=0
 7  snv2sdn1-snv2mr1.es.net (134.55.207.37)  0.824 ms  0.784 ms  0.746 ms
     MPLS Label=107600 CoS=0 TTL=1 S=0
 8  snvcr1-snv2sdn1.es.net (134.55.217.9)  0.871 ms  0.831 ms  0.797 ms
     MPLS Label=174528 CoS=0 TTL=1 S=0
 9  chicr1-oc192-snvcr1.es.net (134.55.209.54)  49.123 ms  48.951 ms  48.921 ms
     MPLS Label=129216 CoS=0 TTL=1 S=0
10  aoacr1-oc192-chicr1.es.net (134.55.209.58)  68.814 ms  68.765 ms  68.842 ms
11  bnl-oc48-aoacr1.es.net (134.55.209.130)  70.561 ms (TOS=0!)  70.596 ms  70.585 ms
12  bnl-esbnl.es.net (198.124.216.114)  70.635 ms  70.589 ms  70.589 ms
13  * * *
14  * * *
15  * * *
|
Number of TCP Streams |
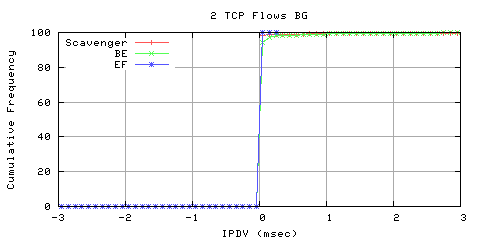
Individiual ping measurements |
EF | BE | Scavenger |
| 0 | 2865 |
Mean: -0.000070ms Stdev: 0.089028ms |
Mean: -0.000070ms Stdev: 0.940310ms |
Mean: 0.000105ms Stdev: 4.453915ms |
| 2 | 1485 |
Mean: 0.000336ms Stdev: 0.008602ms |
Mean: 0.035911ms Stdev: 0.319680ms |
Mean: 0.025823ms Stdev: 0.298773ms |
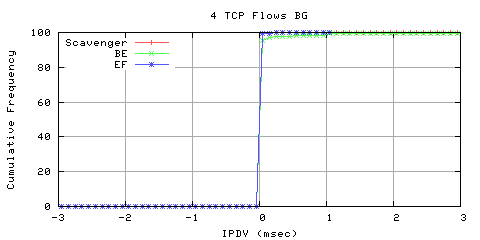
| 4 | 1502 |
Mean: 0.001997ms Stdev: 0.032176ms |
Mean: 0.035552ms Stdev: 0.282420ms |
Mean: 0.033555ms Stdev: 1.218481ms |
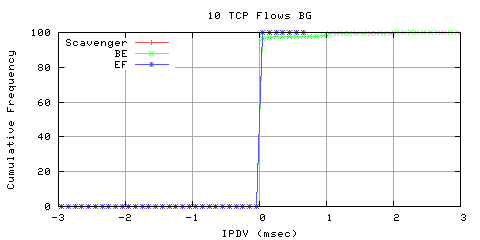
| 10 | 1502 |
Mean: 0.000614ms Stdev: 0.016309ms |
Mean: 0.037158ms Stdev: 0.315468ms |
Mean: 0.000409ms Stdev: 0.009044ms |
 .
.
 .
.
 .
.
|
Background Traffic |
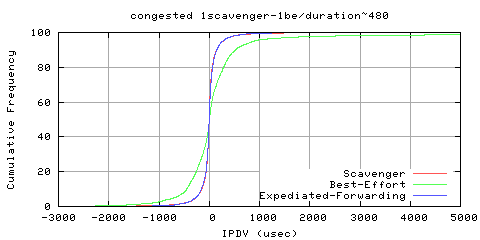
Individiual latency measurements |
EF | BE | Scavenger |
|
Scavenger: 1TCP Best-Effort: 1TCP |
~4500 |
Mean: 0.01 Stdev: 266.36 IQR: 93 |
Mean: -0.012 Stdev: 2778.45 IQR: 413 |
Mean: -0.01 Stdev: 240.44 IQR: 84 |
|
Scavenger: 2TCP Best-Effort: 2TCP |
~4500 |
Mean: -0.00 Stdev: 2081.86 IQR: 98.5 |
Mean: -0.15 Stdev: 4011.20 IQR: 442 |
Mean: 0.01 Stdev: 1933.27 IQR: 107 |
|
Scavenger: 20TCP Best-Effort: 20TCP |
~4500 |
Mean: 0.00 Stdev: 326.67 IQR: 114 |
Mean: 0.01 Stdev: 12815.95 IQR: 354 |
Mean: -0.00 Stdev: 298.78 IQR: 102 |
|
Scavenger: 5Mbit CBR UDP Best-Effort: 1TCP |
~4500 |
Mean: 0.00 Stdev: 367.32 IQR: 69 |
Mean: 12.13 Stdev: 31880.50 IQR: 79 |
Mean: -0.00 Stdev: 6017.93 IQR: 62 |
|
Scavenger: 4Mbit CBR UDP and 4TCP |
~4500 |
Mean: 0.59 Stdev: 388.58 IQR: 66 |
Mean: -0.01 Stdev: 33092.51 IQR: 725 |
Mean: 0.02 Stdev: 5735.23 IQR: 57 |
 .
.
 .
.
 .
.
 .
.
 .
.
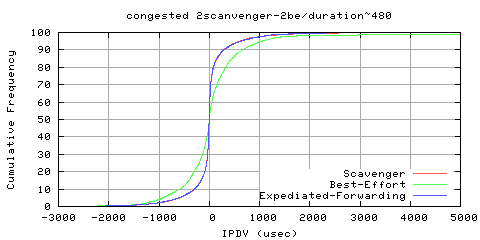
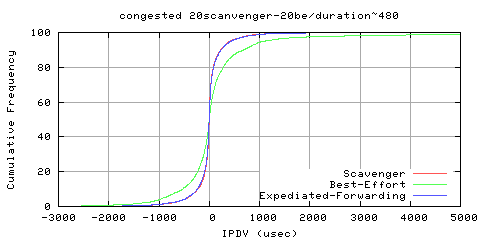
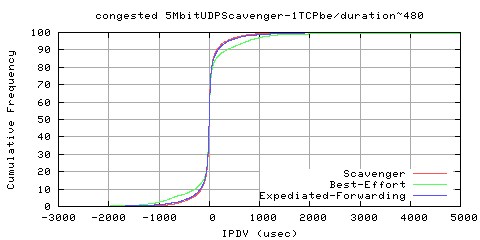
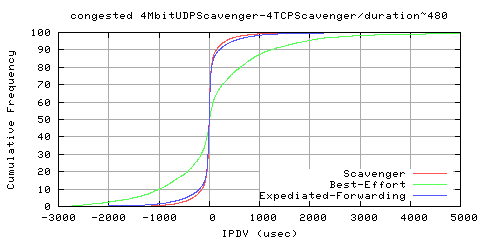
The use of both the IQR and the standard deviations is useful to judge the effects of the background traffic; whilst IQR measurements of the EF traffic were similar to that of the Scavenger path (uncongested), the stdev's can vary quiet substantially (see tests with CBR UDP traffic in the scavenger class).
The Jitter distribution was also larger as seen in the above graphs. Whilst typical variances were small with ICMP (<0.1ms), the experiements with TCP showed noticeable jitter variation of 1ms+. The reasons for this are currently unclear.